

Search for Articles
Article Information Sciences Others Psychology and Education Sociology
Clarifying the Sharpened network diversity in French flair rugby
Journal Of Digital Life.2024, 4,2;
Received:February 17, 2024 Revised:April 1, 2024 Accepted:May 27, 2024 Published:June 20, 2024

- Koh Sasaki
- Research center for health, physical fitness and sports, Nagoya University
- Mitsuyuki Nakayama
- National Team & High-Performance Division, Japanese Rugby Football Union
- Eiji Kutsuki
- National Team & High-Performance Division, Japanese Rugby Football Union
- Kensuke Iwabuchi
- National Team & High-Performance Division, Japanese Rugby Football Union
- Takumi Yamamoto
- Department of Physical Education, National Defense Academy
- Ichiro Watanabe
- Faculty of Liberal Art, Tokyo City University
- Hironobu Shimozono
- Faculty of Sports and Health Science, Fukuoka University
- Jun Murakami
- Faculty of Sports and Health Science, Fukuoka University
- Takashi Katsuta
- Department of Sport & Leisure Management, Tokai University
- Takuo Furukawa
- Faculty of Health and Sport Sciences, University of Tsukuba
- Ichiro Kono
- Faculty of Health and Sport Sciences, University of Tsukuba
Correspondence: sasakikoh@htc.nagoya-u.ac.jp
Abstract
This study aimed that open rugby, known as flair rugby, drives the modern game by analyzing the 2022-2023 international test matches of France representative team. We examined the superiority of a spatial tactic called French flair rugby. First, the advantage of creating a relatively large number of networks was demonstrated. From the transitivity analysis of the network (CUG test; Conditional Uniform Graph test), the cooperation occurs at a higher level than in other networks. The network graph structure showed which players functioned centrally at which time of match as unusual positions, i.e., multi-position and multi-skill. In this study, we operationally defined this diversity as the sum of the standardized eigenvector centralities. We found that the increase in the time-series score balance tended to reduce and sharpened the diversity. As a result of examining a scale-free model in network theory, Sharpening the diversity (central and transitive role players) tended of the network power law scaling.
keywords:
1. Introduction
This study aimed that open rugby, known as flair rugby, would drive the modern game by analyzing the 2022-2023 international test matches of France representative team. Since the opening in 1995, collision rugby has become mainstream. Republic of South Africa team took advantage of it and won Rugby World Cup 2019 and 2023, total fourth world top title. These intensive breakdowns are a hallmark of modern rugby. On the other hand, the increase in intensity has lost the characteristics of creative rugby which explores space, bonds with teammate and seeks to score. Instead of breakdown rugby, we should rethink rugby where we find opened space and avoid collisions. Therefore, this study focuses on the 2022-2023 games of French Flair, which advocate the open rugby.
As a background to the introduction of flair rugby, we summarize the transition of technical development in modern rugby. In the early 1950s, the game of modern rugby was raised from republic of South Africa, and the creation of appropriate technical opportunities, such as “prevention of dangerous plays,” “promotion of unfolded play” (Craven, 1952). So-called three Ps of technical analysis principles, “space position,” “ball possession,” and “pace of time control,” were introduced by New Zealand in the 1960s (Saxton, 1960). As more practical strategy, the concept of “making pressure in offense and defense” (Jones, 1972) and the momentum space strategy, which considered by the relativity of the power relationship, began to be systematically discussed in the late 70s from the United Kingdom (Greenwood, 2003).
A rational attack facing to the defense were categorized from French in the 80s: “Vertical thrust (running) in areas where the line defense is thin, horizontal deployment when thick and dense, and kicks behind the defense line when both are dense” (Deleplace, 1979). In addition, the tactical psychology for development games in which challenge multiple positions, i.e., multiple plays, by creative decision making were also proposed in France (Villepreux, 1979: Boutier, 2007). Since the 2001 British & Irish Lions tour, pod attacks have been circulating (Benett and Thomas, 2003). The idea is to attack the week zone of the four weakly defended divisions (initially 2 pods) with attacking the dispersed forwards. However, the week zone would be based on collision rugby. As defensive tactics have evolved, creative decision making and run-kick techniques have also been devised, some of which are based on French rugby (Jones, 2020; Sasaki et al, 2022: Benett and Thomas, 2003). In this way, the essence of rugby skill is “to make full use of wisdom in unfolded play, to (1) produce free players, (2) keep possession of the ball, and (3) accept some collisions” (Boutier, 2007). And at the end of the art, which is the result of a self-sacrificing effort and lasting contribution, there is a magnificent method of scoring that is unique to rugby: the “infinite goal”. If the two vertical lines of the H-pole are correctly parallel, then a theoretically infinite scoring space would be opened between two straight lines that “never intersect” (Boutier 2007). During the collision and increasing intensity of rugby, there would be a justification for prioritizing the safety of players and positioning flares as a uniquely refined skill in rugby.
Network analysis has been developed in the field of communication network studies (Sasaki et al.,2020). A network has a structure comprising of vertexes and edges. Additionally, if there is a relationship that arises between vertexes, an edge line is drawn. Some typical network studies were flourished in the period from 1960 to 1970 like as “small world phenomenon”, “the strength of weak ties” and “scale-free network.” The third one bases on mathematical developing models associated with networks where some specific small portions of people are connected to many vertexes. Sociological approaches such as these are widely utilized for the construction of predictive models for big data analysis in the field of information technology and for cerebral functions in biology (Junker & Schreiber, 2008; Sanz-Leon, Knock, Spiegler, & Jirsa, 2015; Suzuki, 2017). Furthermore, the direct relationship between network structures and performance in team sports is also discussed, which involves strategic and tactical decision-making in a competitive situation (Duch, Waitzman, & Amaral, 2010; Passos et al., 2010; Yamamoto & Yokoyama, 2011). We have continued some network centrality studies about the offensive and defensive tactics of rugby (Sasaki et al, 2017: 2022a), serious injuries in adolescence (Sasaki et al, 2020), and repeated serious injuries in girls (Sasaki et al, 2022b). Network centrality would help to clarify some organization’s essences like decision-making, strategic functions, and problem solving.
The study is limited to flair rugby in France. Therefore, the perspective of comparing the tactics of various teams would exceed the limits of this study and would be an issue for the future. There would be two types of analysis for team tactics: cross-sectional comparisons between organizations and longitudinal comparisons within organizations. The former would be a way of thinking that limits a certain point in time, expands the space, and considers the different characteristics between organizations. The latter would be a way of thinking that considers time-series changes in an organization by determining the space. This study would be the latter. However, in the future, to grasp both perspectives in an integrated manner, network analysis would be useful because of the accumulation of practical research, and we try the latest method in this study for dedication to promote the essential open rugby.
2. Methods
In a normal positional setup, the first pass from the set play (scrum or lineout) and breakdown is received by the fly-half. Flair is characterized by a variety of developmental plays, in which full-backs, scrum-halves, and center three quarter backs are substituted for their positions. It is called multi-position and multi-skill. Counting the number of passes which contributed to try score, the network data are organized in an adjacency matrix.
In the forward positions, three players in the first row are FR (front row), two in the second row are LO (lock), three in the third row are BR (back row). In the backs positions, number 9 means SH (scrum-half), 10 means FH (fly-half), and 12 and 13 are CTB (center three quarter backs), 11 and 14 are WTB (wing three quarter back), and 15 is FB (full back). All collaborations in these positions are counted. However, the SH pass from the breakdown was omitted because it is redundant information. In this study, we first examine whether the difference in the number of try contribution networks would be related to the winning or losing (score balance).
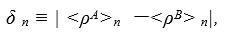
Multi-position networks to the try by unfolded play (including the different position players to FH, CTB position) were integrated at the team level (ρ). (Duch, Waitzman, & Amaral, 2010: Sasaki et al., 2017).

These are calculated as the inter-team performance.
The hypothesis is these to be the indices of winning. To validate this hypothesis, we categorized these indices into team performance that resulted in actual match wins or loses; this helped us determine the distribution of conditional probabilities of the results.
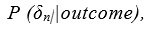
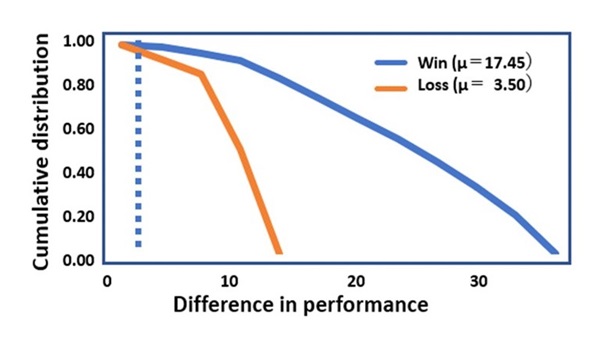
Here, the outcomes are ∈ {“Win”, “Lose”}. Figure 1 shows the cumulative distribution of δ2 for these two outcomes. It explains that teams with higher δ2 evidently contributed to wins.
We set the following to assess the significance of the results.

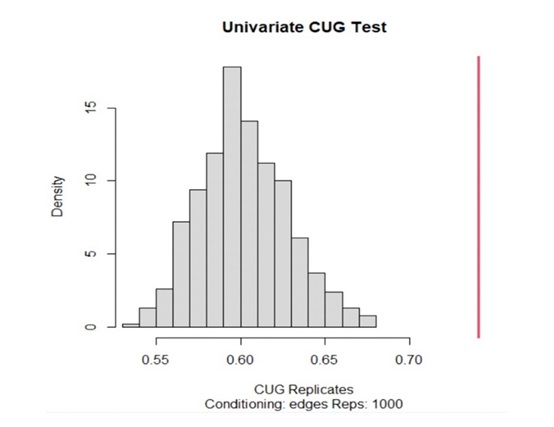
As mentioned in the introduction, network analysis has accumulated many rational results as a method to clarify the cooperation dynamics within an organization. It could help to clarify the essence of an organization, including strategic and tactical decision-making functions in the complex competitive situations of the games. Next, we conduct a statistical study of the transitivity of the network. If the three vertices are connected to each other, then this relationship is transitive. Transitivity is a measure of how many transitive “three vertices” in a network. The reason for the three points is that the flair linkage is connected by two or more passes from set pieces or breakdowns, i.e. three or more players. We would clarify whether this flair pass network has a higher transitivity value than other normal networks. The CUG test (Conditional Uniform Graph test) examines the transitivity distribution through a Monte Carlo simulation in which many directed graphs are randomly generated under the condition that the size (number of vertices) and density of the network are the same. The accuracy, sensitivity, and specificity are defined as follows.
accuracy = (true positive + true negative) / all
sensitivity=TP (true positive) / (TP (true positive) + FN(false negative))
specificity = TN(true negative ) / (FP(false positive) + TN(true negative))
Here, we examine network centricity analysis to clarify who is the central role in the network. We used eigenvector (Ce) centrality which is directly dependent on the centrality values of connected neighbors. If these neighbors have a high centrality value, the vertex under consideration is expected to have a high centrality (Junker & Schreiber, 2008: Sasaki et al., 2017). For a given graph G: = (V, E) with |V| vertices and |E| edges, let (A = aij) be the adjacency matrix. The centrality score of vertexes vcan be defined as:
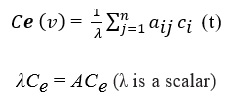
Finally, we use a centricity to explore how diversity changes. The diversity is operationally defined as the total value of the standardized eigenvector centrality. As the total value increases, so does the diversity.
3. Results
We attempted the Monte Carlo methods with bootstrap hypothesis testing to assess Δ2outcome1,outcome2 (Wan, 2011). The values of δ2 from 20 international matches of France in 2022-2023 were pooled, and the surrogate random samples from the pooled data were drawn, with replacement. “Win” and “Lose” samples were drawn with 16 and 4 data points, respectively. The difference in means of the two surrogate samples was then determined. This procedure was repeated 50,000 times to determine the significance of the observed Δ2Win, Loss. A strongly significant difference in mean δ2 was found between the “Win” and “Lose” outcomes (bootstrapping p value <0.01).
The value δ2 was possibly valid as an objective index of performance of flair network passes. Furthermore, to test the precision of sensitivity and specificity of δ2, we analyzed the receiver–operator curve (ROC). In relation to all the varying values of δ2that are quantified values of network passes, we calculated the fraction in the “Win” and “Lose” groups. It was founded that highest correct diagnosis rate of 93.8% was achieved at 100 % sensitivity and 0% specificity, with a cut-off value of 2 (Figure1, blue bot line). The above procedures were followed by Duch’s approach (2010).
The results showed that the relatively large number of flair network pass/kick contributed to the winning. Next, we conducted a statistical study of the transitivity of the network. If the three vertices i, j and k are connected to each other, then this relationship is called transitive. Transitivity measures how many transitive three vertices in a network.
We would clarify whether this flair pass network has a higher transitivity value than other networks in general. The CUG (Conditional Uniform Graph) test examines the transitive distribution through a Monte Carlo simulation that randomly generates many directed graphs, provided by the condition of the size (number of vertices) and density of the network are the same. 1,000 trials were performed with a network density set to the probability of an edge being drawn between vertices. From the obtained transitivity distribution, it could be explained whether the transitivity is greater than the observed value. The histogram of this distribution was compared to the observed transitive positions (Figure 2, red line). The graph showed that the transitivity of the flair path network (0.74) was a sufficiently large value compared to random networks (Suzuki, 2017).
From here, we attempted to find the accuracy of the correct examination rate. The highest accuracy rate of 93.75% was achieved by the cutoff value 2 (Fig. 1, blue dotted line).
We revealed that the network has a high transitivity (three-position bond). Next step, we would examine the network centrality to clarify who is the central role of the network. Centrality is a major focus in network analysis, as it shows which individuals occupy critical positions in the network.
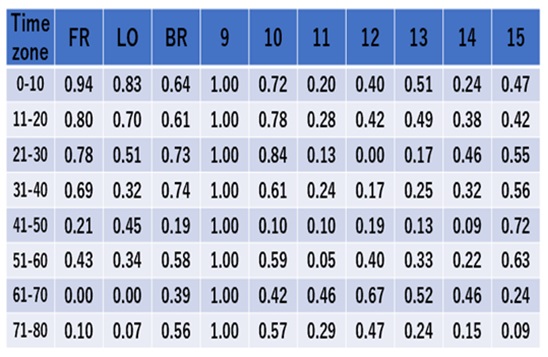
The figure 3 shows the position chain structure involved in all French flair attacking tries using a network dynamics approach. A calculation method is used in which positions with a high degree of contribution are positioned as the center, and the distance between each factor and the linkage line does not overlap as much as possible is used (Sasaki et al., 2022). It could contribute to understand the flair structure in which SH (9), FH (10) and FB (10) play a central role in the passing/kicking network and their own try-contributing functions (Figure 3, Table 2).
Here, the diversity index is operationally defined as the total position value of the standardized eigenvector centrality. That means, as the total value increases, the diversity also increases. Conversely, decrease in the total value means a decrease in diversity. Then, we tracked the transformation structure in the process of accumulating try scores balance over time. As a result, the structure of the inverse correlation trend was verified (r = – 0.61, t = 1.81, p<0.10). In other words, as the cumulative try score increased, the tendency of the core players of cooperative play, which was initially diverse, to become sharper (Figure 4).
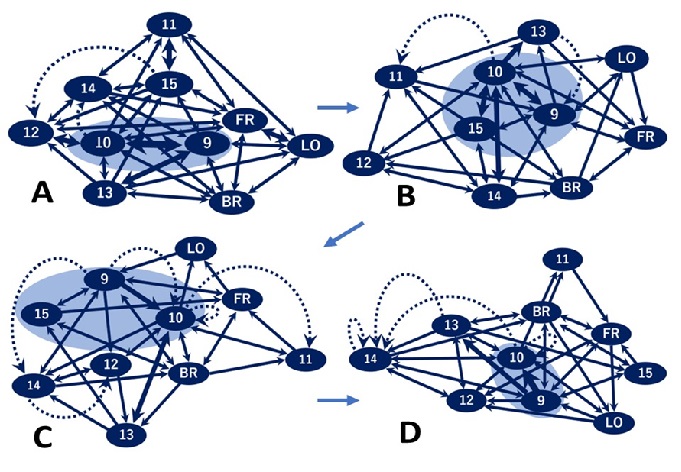

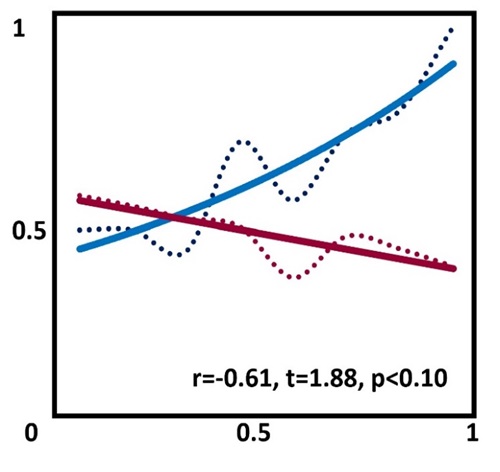
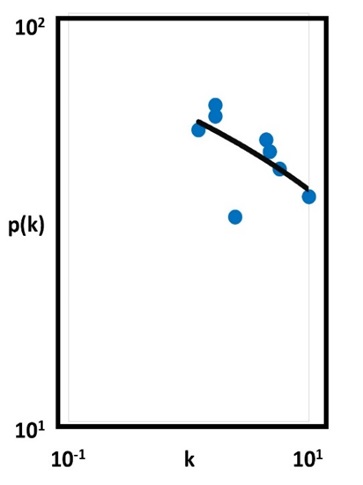
Table 1. France 2022-23 Game Overview
(Accumulated score balance, standardized Accumulated score balance, diversity Index, and γ)
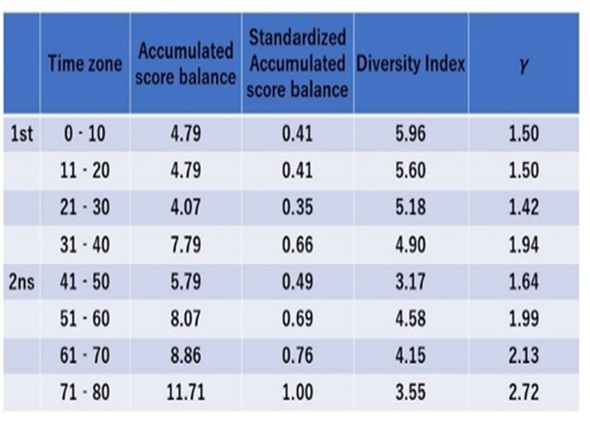
Table 2: Standardized Network Centrality of Each Position (FR; front row ‘1-3’, LO second low ‘4-5’, BR; Back low ‘6-8’, ‘9’; Scrum-half, ’10’; Fly-half, ’11’; Left Wong, ’12’; Inside center, ’13’; Outside center, ’14’; Right wing, ’15’; Full back)
The sharpening of central role players in the time series was seen by the network power law scaling. The horizontal axis of the figure 5 shows the cumulative try score balance (logarithmic), and the vertical axis shows the diversity which means the variation of transitive and central role players (logarithmic). The sharpening of these players suggests the existence of hubs as a transitive central group in a scale-free network (Figure 5, Table 1, 2).
Many natural networks contain several nodes, called hubs, and have more connections than the average node. In this type of network, called a scale-free network, the percentage of nodes with edges decreases according to the power law. The self-organization of networks often coincides with the emergence of a power law distribution. The diversity of try-scoring contributors diminishes as the accumulated scoring over time. If the former is p(k), then k-γ follows the power low scale.
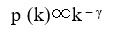
∝ shows proportionality. γ means the exponential value which is constants varying depending on the type of network (Suzuki, 2017). The γ of the French Flare is “ γ = 1.86 ± 0.8” near the range of common values (2<γ<3) which occur in many real world scale free networks (Yamanoto and Yokoyama, 2011: Fujimoto et al., 2023). “Growth” and “preferential attachment” are the two basic mechanisms of scale-free. Growth of the organizational network and the diversity of connections (passes, kicks) between players are a model that explains the characteristics of prioritizing the combination with better, limited human resources over time.
4. Discussion
The relative high number of flair network passes/kicks contributed to the win. In other words, expanding network has an impact on the game score balance structure. FB (15) and other positions were substituted in the FH(10), and SH(9)/FH(10) who had passed the ball once received the ball again and developed to gain spatial advantage.
The French Flair’s chronological increase in try scoring would be due to its reliance on multi-position and multi-skill of SH(9), FH(10), and FB(15). However, it would be due to a variety of kicking and passing abilities and expanding network skills such as looping punt kicks which he reacquires as a hub that includes players in other transitive positions (e.g., a new three-players linkage). (Fig. 3)
It should be noted that although the process would be sharpened in human resources (decreasing the diversity), the structure of play could be more complex creativity with various passes and kicks in the second half compared to the first half. This might be explained by the characteristic of biological networks, in which the index value is relatively small (γ<1), i.e., even if the network does not expand, it could continue to exist by rewiring within a limited organization (Piva et al., 2021).
As rugby games become more intense and faster, the advantage of multi-position/multi-skill skills by the sharpened diverse players have been suggested. In particular, SH (9) would require more momentum and endurance than other positions. Offensive and defensive behavior in rugby has been undertaken as a complex system of prediction, cognition, and behavior. The gap between 1) the opposing tackler, 2) the receiver trying to connect the pass, and 3) the gap between the receiver and the defense facing the receiver, are judged by the ability to predict space and time. It has been verified that as the shortened the time to close the gap, the shortened the time to make a judgment, and the variation of attacks (distance, velocity, angle) decreases (Correia et al, 2011; Watson et al, 2011: Oppici and Panchuk, 2022). Athletes have their own forks in the road in their judgment of space and time. From this viewpoint, flair could be interpreted as a complex adaptive tactic that challenges precise passes, runs, and kicks without slowing down the judgment speed of the limited moment. It would be an individual free play choice among many play patterns accumulated as a game experience situation (Villepleux, 1983: 2017: Vaissière, 2022: Galtie, 2022).
There is an argument that the existence of the life force can be found by challenging the extreme situation of such a complex system. These include dynamic equilibrium theory in biology (Fukuoka, 2009), ontological threat management theory in business administration (Florian et al., 2002), and altruism in sociology (Sharp et al, 2020: Giulianotti and Collison: 2020: Moyo et al, 2020).
Development the flair ability would depend on how to set up the situational judgment in space. In practice of French rugby, the placement of player in the space is set in detail. In a lot of spatial situations, such as 7-on-7, 4-on-4, 3-on-3 and 1-on-1, the passer and receiver must think independently about how to position themselves in space. And the crucial advice is to “try to time the pass as late as possible, not too early, which will lead to the flair that creates more free space (Villepleux, 1983). Challenging the pass as late timing as possible means making decisions as late timing as possible and making final decisions and passing motions as fast as possible. Sharpened and sophisticated decision-making and speeding up of pass/kicking/move would create a new opened rugby (Formenti, D. et al., 2021).
As mentioned at the end of the introduction, this study is limited to flair rugby in France. Therefore, the perspective of comparing the tactics of various teams would exceed the limits of this study. In the analysis of our study, we performed the Monte Carlo simulation (comparison with the normal network) for identifying the specific characteristics of the French flair rugby; however, the obtained results from this analysis only show the differences from the normal network, not from the network of the non-flair rugby team. Therefore, the current analysis could not exclude the possibility that the characteristics which we observe as unique to flair rugby can be observed in other tactics as well. In other words, even if we analyze the “non- flair” rugby team, maybe we can observe the difference from the normal network. We underline that the discussion the exact differences between Flair rugby networks and non-flair rugby networks is an issue for the future. Categorizing the performance of flair rugby, which is not limited to France, would be a key issue for the spread of open rugby.
5. Conclusion
In this study, we examined the superiority of a spatial tactic called French flair rugby. First, the advantage of creating a relatively large number of making networks was demonstrated. The network graph structure showed which players functioned centrally at which time of game in unusual positions, i.e., multi-position and multi-skill, as the spatial skills. As a result of examining a scale-free model in network theory, progressing the time-series accumulation of try score balances, the diversity of the hubs players functions the centrally role, and the hubs would become more radical and sharpened.
The central involvement in the play begins with a triangular structure of SH (9), FH (10), and FB (10), the diversity of which gradually decreases. It would be a structure that encompasses the two basic mechanisms of a scale-free network: growth and preferential attachment. The growth of the organizational network and the diversity of connections (passes, kicks) between players are a model that explains the characteristics of prioritizing the combination with better and limited human resources. However, the decrease in its diversity suggests an interesting human behavior: a sharpening of the spatial behavior of play might create a qualitative transitivity of the human network.
The reduction in diversity would have a benefit that key players contribute a stronger force to survive the competition. On the other hand, it also has the disadvantage of continuing to impose a heavy burden on the players. To compensate for this disadvantage, the players might challenge to create new and progressive diversity in their own life-force potential.
The logic of the power law is that the key persons are centralized and converged. It is shown as a decrease in the number of players with high flare ability. However, time-series changing in Figure 3 showed that the number of passing network variations with kicks tends to increase. In other words, the two-dimensional diversity centered on passing in the first half has been transformed into a three-dimensional diversity with kicking in the second half. In this sense, the characteristic of flair would be that the network “shrinks” in two dimensions (reduction in lateral passing attacks), but it might be interpreted as a transformation into a three-dimensional expansion (expansion of attacks with kicks) to “sharpening”. This result might be considered a new possibility of interpretation of the power law logic.
Author Contributions
Conceptualization, K.S.; methodology, K.S.; software, M.N., E.K., K.I. and T.Y.; validation, K.S., M.N. E.K. and K.I.; formal analysis, K.S.; investigation, K.S., M.N., H.S., J.M. and T.F.; resources, M.N., K.I. and T.Y; data curation, K.S.; writing—original draft preparation, K.S.; writing—review and editing, K.S.; visualization, K.S.; supervision, K.S.; project administration, K.S., I.W., T.K., and I.K.
Funding
This research received no external funding.
Institutional Review Board Statement
All procedures used in this study were approved by the Ethics Committee of the Research Center for Health, Physical Fitness and Sports, Nagoya University.
Conflicts of Interest
The authors declare no conflict of interest.
References
Benett, P., & Thomas, G. (2003) Phill Benett: The autobiography. Collins Willow.
Colomer, C. M. R., Pyne, D. B., & Mooney, M. (2022) A qualitative study exploring tactical performance determinants from the perspective of three Rugby World Cup coaches. International Journal of Sports Science & Coaching 2022, 17(4), 734–741.
Correia, V., Araujo, D., Craig, C., & Passos, P. (2011) Prospective information for pass decisional behavior in rugby union. Human Movement Science, 30, 984–997.
Craven, D. (1953) Danie Craven on Rugby. Wellington.
Delplace, R. (1979) Rugby de movement, rugby total. Paris, Ed. EPS.
Duch, J., Waitzman, J. S., & Amaral, L. A. N. (2010). Qualifying the performance of individual players in a team activity. Plos One, 5(6), e10937. doi: 10.1371/journal.pone.0010937
Eaves, S., & Hughes, M. (2003) Patterns of play of international rugby union teams before and after the introduction of professional status. International Journal of Performance Analysis in Sport, 3(2), 103-111.
Florian, V. et al. (2002). The anxiety-buffering function of close relationships: Evidence that relationship commitment acts as a terror management mechanism. Journal of Personality and Social Psychology. 82 (4), 527–542.
Fukuoka, S. (2009) Dynamic equilibrium. Kirakusya.
Formenti, D. et al. (2021) Differences in inhibitory control and motor fitness in children practicing open and closed skill sports. Scientific report. 11: 4033.
Fujimoto, K. et al. Beyond scale-free networks: integrating multilayer social networks with molecular clusters in the local spread of COVID-19. Scientific Reports. 13: 21861 (2023)
Gaithie, F. (2022) XV de France. Galthié donne sa vision du French Flair, qui fait partie de son projet de jeu. ACTU.RUGBY.
Giulianotti, R., & Collison, H. (2020) Sport and the Covid-19 Pandemic: A Structuralist Analysis of Key Themes in the UK Mass Media. Front. Sports Act. Living. 2: 578472.
Greenwood, J.T. (2003) Total rugby 5th edition. A&C Black; London.
Jones, Brian. et al. (1972) Rugby under pressure. Faber and London.
Jones, E. (2020) My life and rugby. Macmillan.
Junker, B., & Schreiber, F. (2008). Analysis of biological networks. Hoboken, NJ: Wiley.
McCormick, J. (2019) Revolutionising Rugby- a statistical analysis of how the game has evolved. Stats Perform. https://www.statsperform.com/resource/revolutionising-rugby-a-statistical-analysis-on-how-the-game-has-evolved/
Millard, L., Breukelman, G.J., Burger, T., Nortje, J., & Schülz, J. (2022) A review of the essential visual skills required for rugby: Beyond 20-20 optometry. Research Square. 1-15.
Moyo, T.Y., Duffett, R., & Knott, B. (2020) Environmental factors and stakeholders influence on professional sport organizations engagement in sustainable corporate social responsibility: A south African perspective. Sustainability, 12, 4504.
Oppici, L., & Panchuk, D. (2022) Specific and general transfer of perceptual-motor skills and learning between sports: A systematic review. Psychology of Sport and Exercise. 59, 102118
Passos, P., Davis, K., Araujo, D., Paz, N., Minguns, J., & Mendes, J. (2010). Network as a novel tool for studying team ball sports as complex social systems. Journal of Science & Medicine in Sport, 14, 170–176.
Piva, G. G., Ribeiro, F. L., & Mata, A. S. (2021) Networks with growth and preferential attachment: modelling and applications, Journal of Complex Networks, 9(1), February 2021, cnab008
Runswicka, O.R., Green, R., & North, J.S. (2020) The effects of skill-level and playing-position on the anticipation of ball-bounce in rugby union. Human Movement Science, 69; 102544.
Sanz-Leon, P., Knock, S. A., Spiegler, A., & Jirsa, V. K. (2015). Mathematical framework for large-scale brain network modeling in The Virtual Brain. NeuroImage, 111, 385–430.
Sasaki, K., Yamamoto, T., Miyao, M., Katsuta, T., & Kono, I. (2017) Network centrality analysis to determine the tactical leader of a sports team. International Journal of Performance Analysis in Sport, 17(6), 822-831.
Sasaki, K., Sato, H., Nakamura, A, Yamamoto, T., Watanabe, I., Katsuta, Y., & Kono, I. (2020) Clarifying the structure of serious head and spine injury in youth Rugby Union players. PLoS ONE, 15(7): e0235035.
Sasaki, K., Nakayama, M., Iwabuchi, K., Yamamoto, T., Watanabe, I., Shimozono, H., Murakami, J., Katsuta, T., & Kono, I. (2022a) Ranking performance and network structure in world rugby sevens; 2011-2020 longitudinal data analysis. Journal of Digital Life.
Sasaki, K., Iwabuchi, K., Watanabe, I., Nakamura, A., Yamamoto, T., Asami, K., Tsubakihara, T., Nakayama, M., Sato, H., Hirai, H., Saito, M., Miyazaki, Z., Katsuta, T., & Kono, I. (2022b) Clarifying the structure of repeated serious injuries on female rugby players. SCIREA J. Clinical Medicine, 7(1), 39-53.
Saxton, C.K. (1960) The A.B.C. of Rugby. The Otago Daily Times and Witness Newspapers Company.
Sharp, S., Mountifield, C., & Filo, K. (2020) The Social Media Response From Athletes and Sport Organizations to COVID-19: An Altruistic Tone. International Journal of Sport Communication,13(3): 474–483.
Spamer, E.J., Plessis, D.J., & Kruger, E.H. (2009) Comparative characteristics of elite New Zealand and South African u/16 rugby players with reference to game; specific skills, physical abilities, and anthropometric data. South African Journal of sports medicine, 21(2), 54-57.
Suzuki, T. (2017). Network analysis 2nd version. Kyouritsu Shuppan.
Villepreux, P. (1979) Le Rugby. Paris, Denoel.
Villepleux, P. (1983) 13 Coaching the backs, The principles of rugby football. Gerge Allen & Unwin; London. Villepreux. P. (2017) Le French flair, c’était de l’intelligence de jeu.
Wan, J. (2011). An introduction to bootstrap analysis. Tokyo: Kyouritsu Shuppan.
Watson, G. et al. (2011) Judging the ‘passability’ of dynamic gaps in a virtual rugby environment. Human movement Science, 30(5), 942-956
Yamamoto, Y., & Yokoyama, K. (2011). Common and unique network dynamics in football games. Plos One, 6(12), e29638. https://doi.org10.1371/journal.pone.0029638002E
Relevant Articles
-

A Study on the Effectiveness of Glycerophosphocholine (α-GPC) as an e-Sports Supplement
by Yuki Kamioka - 2025,5
VIEW -
An attempt to realize digital transformation in local governments by utilizing the IT skills of information science students
by Edmund Soji Otabe - 2025,4
VIEW -
Wildlife Approach Detection Using a Custom-Built Multimodal IoT Camera System with Environmental Sound Analysis
by Katsunori Oyama - 2025,S2
VIEW -
Research on Indoor Self-Location Estimation Technique Using Similar Image Retrieval Considering Environmental Changes
by - 2025,S3
VIEW