

Search for Articles
Article Electrical and Electronic Engineering Information Sciences
Development of Sensing Unit “xG-1” for Visualizing Team Plays
Journal Of Digital Life.2023, 3,10;
Received:May 16, 2023 Revised:June 6, 2023 Accepted:July 21, 2023 Published:September 27, 2023

- Takayuki Yamada
- xSENSING Co., Ltd.
- Hidekazu Masaki
- xSENSING Co., Ltd.
- Yutaka Matsubayashi
- xSENSING Co., Ltd.
- Shigenori Tanaka
- Faculty of Informatics, Kansai University
- Ryuichi Imai
- Faculty of Engineering and Design, Hosei University
- Takeshi Naruo
- Organization for Research and Development of Innovative Science and Technology, Kansai University
- Kenji Nakamura
- Faculty of Information Technology and Social Sciences, Osaka University of Economics
- Yuhei Yamamoto
- Faculty of Environmental and Urban Engineering Department of Civil, Kansai University
- Wenyuan Jiang
- Faculty of Engineering, Osaka Sangyo University
- Chihiro Tanaka
- Former Organization for Research and Development of Innovative Science and Technology, Kansai University
Correspondence: kyo@ce.osaka-sandai.ac.jp
Abstract
The authors have developed "xG-1", a sports sensing unit capable of visualizing the performance and flow of play while recognizing each player in field sports such as soccer, rugby, and American football. Utilization of this sensing unit in the field of sports makes it possible to provide scientific data-driven services with the aim of transforming subjective coaching methods based on experience into new coaching methods based on data. This system consists of sensor devices and software, utilizing real-time kinematic (RTK) positioning, which is a surveying technology. Therefore, the system not only provides highly accurate positional data in real time but also visualizes the overall performance of the entire team, including formation analysis. This allows one-stop management of the overall team and individual performance, as well as efficient information management of the player's exercise load. "xG-1" can support sports businesses by providing highly extensible API and SDK and linking data among end users and systems. In the future, we aim to develop a global open data platform.
1. Introduction
Looking ahead to the “super-smart society” that Society 5.0 is aiming for and the world after the “Tokyo Olympics”, the authors released “xG-1” in December 2020 for the purpose of providing high-quality services to the sports business scene and contributing to the increase in the sports population and the expansion of the sports market. Utilizing real-time kinematic (RTK) positioning, a surveying technology, “xG-1” not only provides highly accurate data obtained by wearable devices in real time but also visualizes the overall performance of the entire team. This makes it possible to change the traditional subjective sports coaching and evaluation based on the experience of coaches into new data-based coaching, thereby realizing innovation into a more data-driven world in the field of sports and maximizing the performance of the players. In addition, its cloud service provides one-stop management of the performance of the entire team and individuals, efficient information management of players’ exercise load, and supports for data business activities surrounding the sports market as well as end-users through the provision of highly extensible API and SDK.
2. Needs for Sports Information Processing
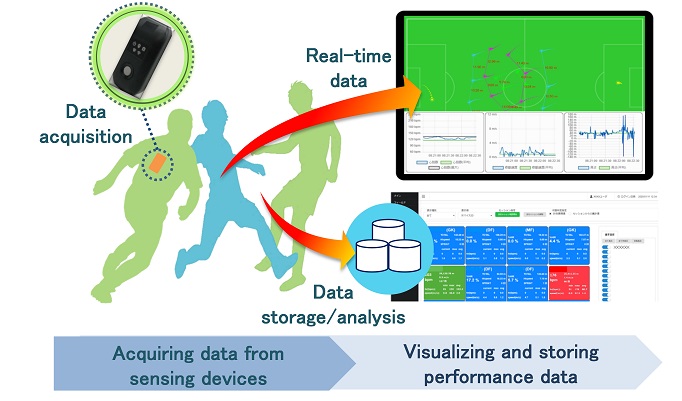
The sports tech market is expected to expand rapidly. The size of the domestic market for IoT-based sports equipment and services is calculated to be approximately 68.5 billion yen in 2025, according to the forecast by Nomura Research Institute, Ltd. (Nomura Research Institute, 2019). Moreover, according to the estimate of Grand View Research Inc.’s(Grand View Research, 2019), the global sports analytics (software and services) market is forecasted to reach US$4.6 billion in 2025. The products for the sports tech market are diverse, and sports sensing units that measure the position of players and their actions during games have been actively developed mainly in foreign countries. However, since they have some problems including the lack of analytical functions for detailed understanding and analysis of the player’s condition in addition to the low customizability of functions, not meeting the needs of the Japanese market has hindered their widespread use. This paper introduces “xG-1,” a sports sensing unit developed by the authors to solve these problems. Figure 1 shows the development concept.
This unit consists of a data acquisition function that collects players’ positional, postural, and vital information using sensing devices, a visualization function that displays players’ performance data in real time from the data(Jiang, W., et al. 2019), and a reporting function that reports the growth process from time-series data stored on the cloud. On the other hand, after having experts try out existing visualization system (Jiang, W., et al. 2019), it became clear that there is a demand for new features. Specifically, features such as a dashboard showing the timing of player substitutions and a function for comparing exercise intensity were mentioned. Therefore, in this research, we aim to develop a system that can satisfy both the need of coaches to grasp the conditions of players in real time and give them instructions during games, and a need to grasp the degree of growth and conditions of players by analyzing their data for each practice up to games. Also in this system, by utilizing RTK surveying technology, relative positioning can be achieved in real time instead of single-point positioning, thereby providing highly accurate analysis data in real time, which is superior to existing system.
3. System Concept
Figure 2 shows the system configuration. The system has two mechanisms: one that stores data measured in the sports field environment in the cloud via Wi-Fi(PCT patent, 2018a), and one that installs the sensing devices that have completed measurement on the station and make bulk registration in the cloud via (PCT patent, 2018b).
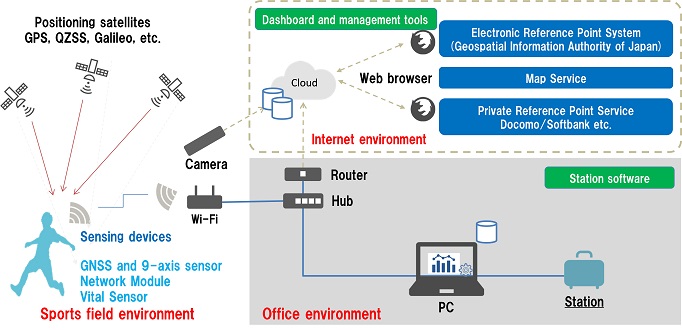
This service achieves RTK positioning by utilizing a private reference point service that adopts Japan’s electronic reference point system or by installing a reference point at one’s own station. It can support decision-making in the field immediately by converting highly accurate measurement data into the performance data of players. The same service can be used overseas as well.
4. Sensing Device
“xG-1” consists of a highly accurate RTK-GNSS sensor and an inertial sensor (IMU: inertial measurement unit) capable of measuring 9 axes of acceleration, angular velocity, and geomagnetic field (Figure 3).
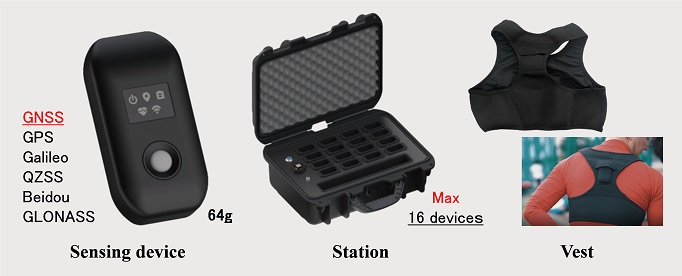
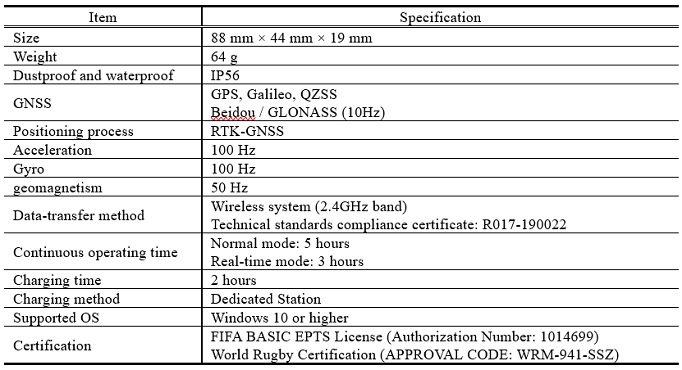
Table 1 shows the specifications of this device. The device is compatible with multiple satellites, including the quasi-zenith satellite MICHIBIKI. Its positioning accuracy allows a margin of error within a few centimeters when stationary, and within a few tens of centimeters when jogging or sprinting. It allows highly accurate positioning in any place and situation.
Table 1. Specifications for the sensing device of xG-1
Furthermore, by using 9-axis sensor data including data on angular velocity in the three axes of pitch angle, roll angle, and yaw angle (Figure 4), as well as acceleration sensor and magnetic field sensor from the gyro sensor built into the IMU, it is possible to grasp the posture, detailed movements, and impact of the players that are difficult to confirm by visual check or GNSS data. Additionally, these sensor values can be analyzed comprehensively to analyze events such as falls and jumps during exercise.
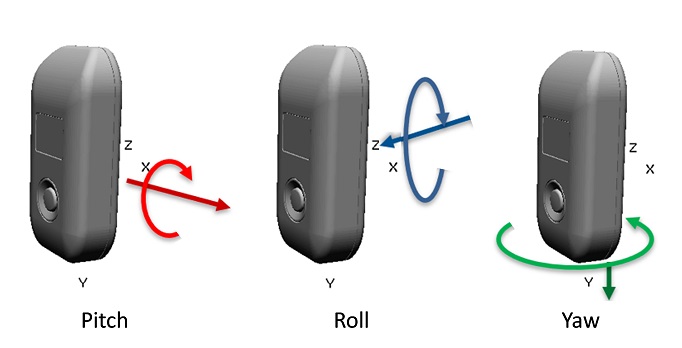
Table 2 shows typical data items that can be measured with this device. Information such as impact strength, heart rate, and detailed posture is difficult to measure from video images and can be considered as analysis items peculiar to wearable devices. The measured data can be imported into the computer by using the attached station (Figure 3) and station software. The station can store up to 16 sensing devices, and can be used for charging, data downloading, and maintenance. The status of charging or download status of measurement data can be easily checked on the computer.
Each player wears a special vest under the uniform and puts on a sensing device in a pocket on the back. On the computer, it is possible to check the player’s performance, such as running speed and exercise intensity, as well as playing conditions, such as formation based on positional information. This device has a 2.4GHz wireless communication function in the 2.4GHz band, allowing visualization of the data measured with different sensors in real time. The heart rate of the player can also be checked simultaneously with other information by putting on the attached heart rate sensor. By recording and storing these pieces of information and feeding them back to the entire team or individuals, data-driven training coaching can be realized, such as reviewing based on the data, efficient analysis of tactics, and reinforcement of the formation play.
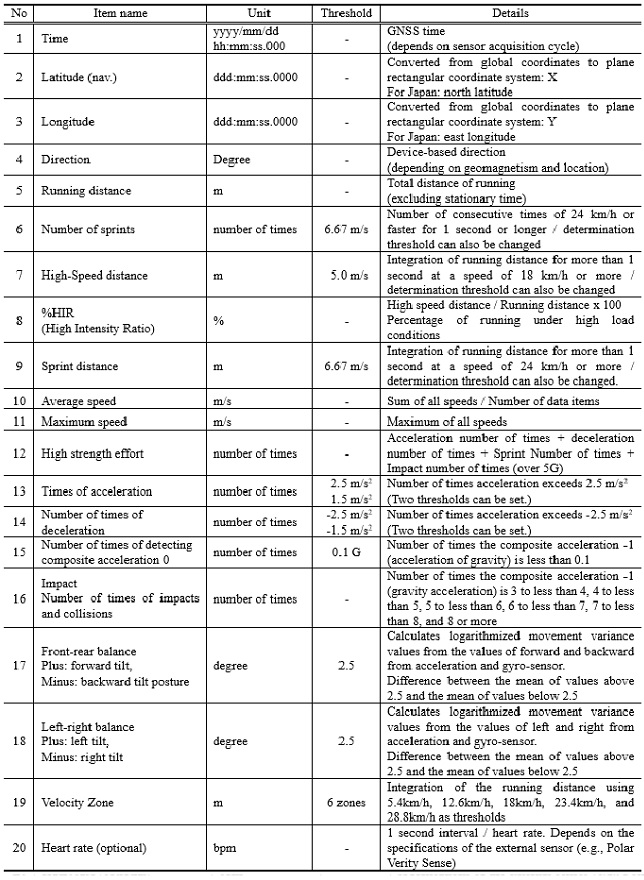
Table 2. Typical data items that are measurable
This device has already obtained FIFA EPTS and World Rugby certification, which are required for using the devices in international soccer and rugby tournaments. It can be used in these official matches.
5. Software
The software consists of a dashboard screen (Section 5.1), a station screen (Section 5.2), and a management tool screen. It is used to operate the management tool screen smoothly over the entire system.
5.1. Dashboard Screen
The dashboard screen provides functions about the analysis of the acquired data on players (mainly four functions).
5.1.1. Field Functions
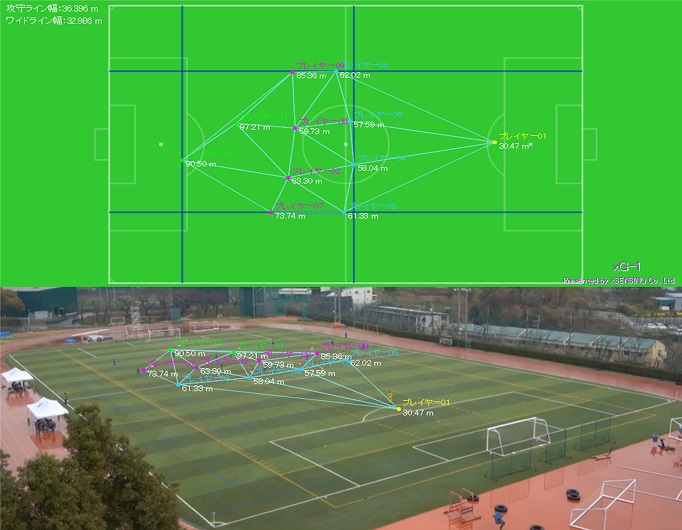
This function is used to visualize formation information such as player positioning, distance between positions, and team compactness by mapping time-synchronized player positions and sensor information on the field of the dashboard (Figure 5). In addition, by linking with video taken at a fixed point, the positional information of players acquired from the sensors can be reproduced on the video, enabling provision of feedback while confirming the positioning.
5.1.2. Panel function
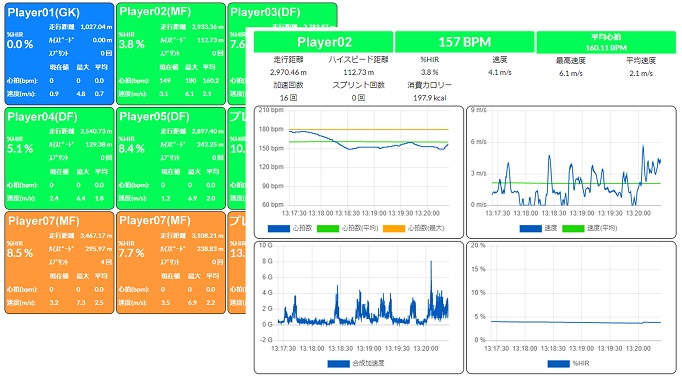
This function is used to visualize all of the sensor data in real time. It allows checking a series of conditions of a player, for example, as shown in Figure 6 (left), by alerting with change in the color of the player’s panel when data value such as the heart rate or running distance exceeds the preset threshold value, and as shown in Figure 6 (right), by graphing the last three minutes of data values. This can be utilized to suggest the timing of changing players during matches or practices.
5.1.3. Function of Exercise Intensity Analysis
As Figure 7 shows, this function is used to visualize the amount of exercise, such as the running distance or high-speed distance of a team or individuals, during a specified period (one week / four weeks) in a graph to make an analysis of exercise intensity.
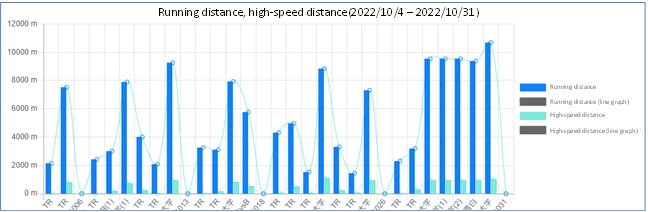
Figure 7. Function of exercise intensity analysis (for 4 weeks) (dashboard screen)
In addition, as Figure 8 shows, the Acute Chronicle Workload Ratio (ACWR), an indicator of the risk of injury during the given period, can be analyzed based on the values of each item. By analyzing the items such as running distance, high-speed distance, and the number of sprints, it is possible to manage the peak of the team’s physical activity during training, and to achieve peaking and injury control in preparation for matches.
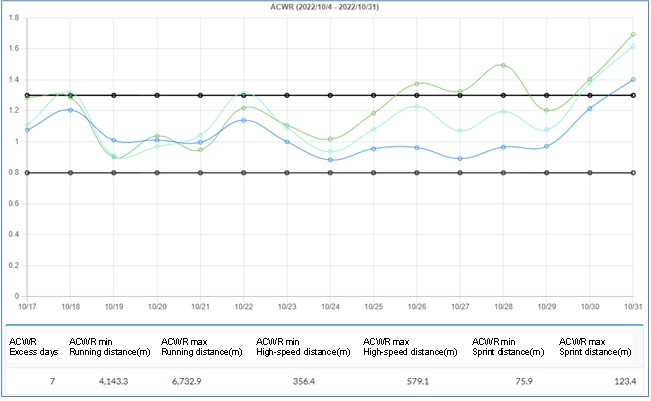
Figure 8. Exercise Intensity Function (ACWR) (dashboard screen)
5.1.4. Comparison Function of Exercise Intensity
This function enables comparison of data from different time periods within one’s own team, as well as data from other top teams (professional/working adults/university/high school/junior high school) that are summarized as shown in Figure 9.
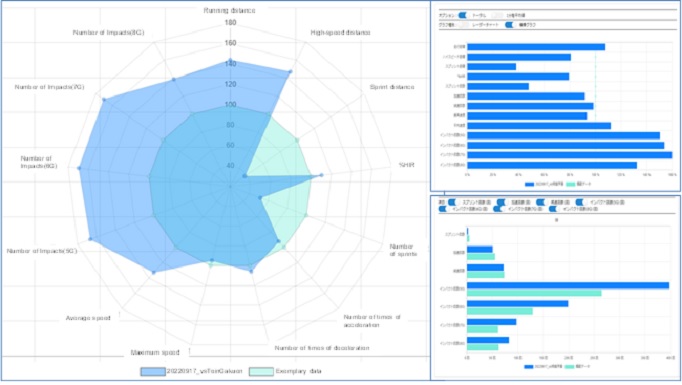
Figure 9. Comparison function (dashboard screen)
5.2. Station Screen
The station screen requires functions to aggregate information for the entire team, such as visualization of the status of each sensing device and data management. In specific, it consists of the following three functions to:
- Visualize the charging status and remaining battery power of the sensing devices.
- Download data with high-speed from multiple sensing devices simultaneously.
- Output reports including heatmaps from registered matches and practice menus in Excel or PDF format.
In particular, the function of creating the heat map of play allows visualization of the positioning of all players for each time period, as Figure 10 shows. It is also possible to output detailed data such as the average position of the players and the location, time, direction, and the number of sprints throughout the match in Excel or PDF format.
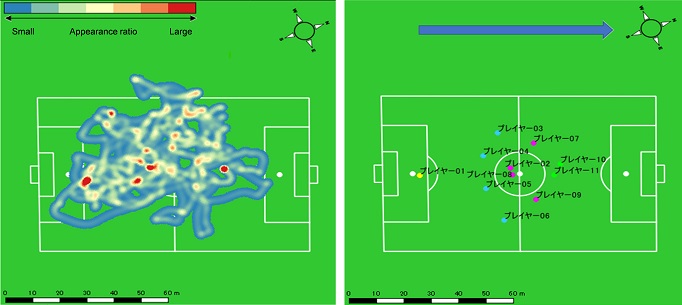
Figure 10. Heat map function of play (station screen)
6. Examples of Utilization
This system is provided to over 50 teams, including professional, university, and high school level teams.
In professional settings, for example top teams in the J-League, sports scientists use the highly accurate location and speed data to determine where sprints and acceleration/deceleration occurred, which is utilized in reviewing game results. During games, they review whether the offensive and defensive tendencies matched their tactics by examining the changes in data for each position over different periods of time.
Moreover, medical coaches utilize the system as foundational data for rehabilitation of injured players. In field sports like soccer, there is a tendency for injuries to occur frequently, particularly to the knee and ankle. For the running training program aimed at recovery, they verify the difference in acceleration force for each step and the body’s axis using data. This not only measures the muscular strength of the injured part externally, but also verifies the mechanical balance of the body during acceleration, providing valuable data.
In universities, the quality of training menus is checked numerically by changing details of the training, such as altering the location of ball distribution in 2vs2 drills and adjusting the running load by the number of accelerations.
In high school teams, players consciously view the numerical data, which synchronizes their performance checks for training and games. By comparing data with other categories, they can understand their own position.
In this way, users from each layer utilize the various features, and in the end, the system has received high praise, with all teams expressing their satisfaction.
7. Conclusion
We have developed a sensing system for field sports capable of not only measuring the position and actions of each player with high accuracy, but also analyzing the formation of the entire team. By providing this system at a low price, we can contribute to the diffusion and promotion of data-based coaching methods not only for professional sports but also for amateur sports such as in university and high school. Furthermore, while considering its application to enhancement of sports competitions as well as for entertainment, we aim to promote open data in the sports world in Japan, increase in the sports population, health, and new businesses. For example, by introducing these systems, we aim to innovate the environment in which the players of developmental generation can start to experience sports information science. Besides, by accumulating and analyzing performance data obtained from club teams, which are the data content holders, on the “platform,” it will be possible, for example, to provide advisory teachers of club activities at elementary, junior high, and high schools who are not professional sports coaches with services such as tactical analysis and support for planning practice menus.
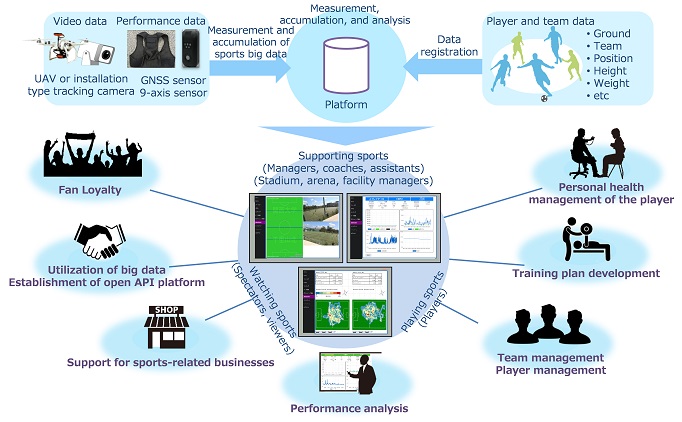
As further technical developments, the authors have been developing a time synchronization system for processing multiple sports videos(Umehara, Y., et al. 2021), a method for estimating the success or failure of a pass in American football(Tanaka, C., et al. 2022b, Tanaka, C., et al. 2022a), and an automatic panorama video generation system(Naruo, T., et al. 2022). Our goal is to deepen the sports events into the entertainment with bodily experiences for both spectators and media viewers by providing real-time performance data to the spectators who visit stadiums and arenas as well as to the media, and sharing the perspectives of coaches and players with them. In the future, we are planning development as a business platform using open data in the sports world (Figure 11), and provide services to those who play, watch, and support sports. We will continue to challenge the scheme of the platform for sports strategy systems mainly for field sports by integrating the sensing devices and software provided by the authors, tactical analysis, and techniques such as Deep learning that utilizes sports videos.
Author Contributions
Conceptualization, H.M., Y.M., S.T. and R.I.; methodology, T.Y., T.N., K.N. and Y.Y.; software, T.Y., W.J. and C.T.; validation, T.Y., W.J. and C.T.; formal analysis, T.Y., T.N., K.N. and Y.Y.; investigation, T.Y., T.N., Y.Y., W.J. and C.T.; resources, T.Y., T.N., K.N. and Y.Y.; data curation, T.Y., T.N., K.N., Y.Y., W.J. and C.T.; writing—original draft preparation, S.T., T.Y., W.J. and C.T.; writing—review and editing, S.T., K.N., Y.Y. and W.J.; supervision, H.M., Y.M., S.T. and R.I.; project administration, H.M., Y.M., S.T. and R.I.; funding acquisition, H.M., Y.M., S.T. and R.I.
Funding
This research was funded by xSENSING Co., Ltd., Intelligent Style Co., Ltd. and Kansai University.
Conflicts of Interest
The authors declare no conflict of interest.
References
Grand View Research (2019). Inc. Sports Analytics Market Size Worth $4.6 Billion By 2025 | CAGR: 31.2%.
Jiang, W., Yamamoto, Y., Nakamura, K., Tanaka, S., Tanaka, C., Masaki, H., Yamada, T., Fujimoto, Y. and Naruo, T.(2019). Research and Development of Coach Oriented Visualization System for Field Sports, Journal of Information Processing Society of Japan, 60(5), pp.1212-1227.
Naruo, T., Nishita, Y., Umehara, Y., Yamamoto, Y., Jiang, W., Nakamura, K., Tanaka, C., Sakamoto, K. and Tanaka, S. (2022). Development of Technology for Generating Panorama and Visualization Using Two-viewpoint Images, Journal of Digital Life, 2, 1-7, https://doi.org/10.51015/jdl.2022.2.12.
Nomura Research Institute(2019). IT Navigator 2020.
PCT patent(2018): JASIA006PCT Moving Body Information Detection Terminal.
PCT patent(2018): JASIA007PCT Moving-body Information Providing System, and Moving-body Information Providing Program.
Tanaka, C., Yamamoto, Y., Jiang, W., Tanaka, S., Hayashi, I., Nakamura, K. and Nakajima, S.(2022). Research for Supporting Tactical Analysis Concerning Pass Skeleton in American Football -Demonstration Experiment-, Image Laboratory, 33(4), 24-34.
Tanaka, C., Yamamoto, Y., Jiang, W., Tanaka, S., Hayashi, I., Nakamura, K. and Nakajima, S. (2022). Research for Supporting Tactical Analysis Concerning Pass Skeleton in American Football -Survey and Proposal-, Image Laboratory, 33(3), 27-34.
Umehara, Y., Yamamoto, Y., Jiang, W., Teraguchi, T., Tanaka, S. and Sato, M.(2021). Research on Time Synchronization Between Video Cameras and Between Video Camera and GNSS for Person Measurement”, Journal of Japan Society of Photogrammetry and Remote Sensing, 60(3), 129-143.
Relevant Articles
-

An attempt to realize digital transformation in local governments by utilizing the IT skills of information science students
by Edmund Soji Otabe - 2025,4
VIEW -
Fundamental Study on Detection of Dangerous Objects on the Road Surface Leading to Motorcycle Accidents Using a 360-Degree Camera
by Haruka Inoue - 2025,S1
VIEW -
Wildlife Approach Detection Using a Custom-Built Multimodal IoT Camera System with Environmental Sound Analysis
by Katsunori Oyama - 2025,S2
VIEW -
A Study on the Development of a Traffic Volume Counting Method by Vehicle Type and Direction Using Deep Learning
by Ryuichi Imai - 2025,S4
VIEW