

Search for Articles
Special Issue Engineering in General
Challenges of Tourists Evacuation in Tsunami Considering with Population Distribution
Journal Of Digital Life.2025, 5,S7;
Received:November 21, 2024 Revised:July 8, 2025 Accepted:August 13, 2025 Published:September 16, 2025

- Atsushi Uechi
- Faculty of Engineering, University of the Ryukyus
- Daisuke Kamiya
- Faculty of Engineering, University of the Ryukyus
- Rinka Arakaki
- Faculty of Engineering, University of the Ryukyus
Correspondence: uechi_fn9s@cs.u-ryukyu.ac.jp
Abstract
Tourist attractions on islands are concentrated in coastal areas, and tourists are at high risk of being struck by a tsunami. It is acknowledged that tourists, due to their unfamiliarity with the area, may benefit from the evacuation guidance provided by residents. However, it is important to note that numerous issues persist within the current disaster risk reduction measures. In this study, the number of disaster victims was clarified based on the distribution of people by time of day in Ishigaki city and Miyakojima city, Okinawa Prefecture. From the perspective of evacuation support, the overlap between residents and tourists was analyzed using a “niche overlap index” to identify areas where evacuation guidance by residents is difficult and areas and time periods where support can be expected.
1. Introduction
The 2004 Sumatra earthquake resulted in an unparalleled tsunami that caused damage to countries along the Indian Ocean coast (Kawata, 2005). The tsunami that struck Phuket, Thailand, a world-class tourist destination, resulted in the loss of life not only among the local population but also among numerous tourists from abroad. This large-scale disaster has served to underscore the critical importance of “tourism risk management” in tourist destinations on a global scale.
The concept of tourism crisis management has been a subject of active discussion in countries where tourism constitutes a significant industry. The establishment of a crisis management system is imperative to ensure the sustainability of the tourism industry. Beirman, D., “Crisis Management in Tourism” aims to present theories and measures for a clearer understanding of consumer, economic, and environmental reactions to crises, and to provide guidelines for relevant operators to prepare for such situations and learn how they should operate during a crisis (Beirman, 2020). It offers a comprehensive guide to assist businesses in preparing for and managing operations during a crisis. (Glaesser, 2006).
Japan is a country that is susceptible to earthquakes, and the resulting tsunami disasters can have a significant impact on regional sustainability. In response to such disasters, hard measures, such as tsunami breakwaters, are being developed. Soft measures are also being implemented, including free pamphlets featuring hazard maps, multilingual evacuation information apps, and voice guidance. However, there are concerns that the construction of tsunami breakwaters in coastal tourist areas will spoil the scenery. Additionally, free newspapers and apps often fail to reach visitors who do not actively seek out information. Furthermore, it takes time for audio guidance to convey information, which poses challenges in terms of effectiveness. As complementary solutions to these limitations, physical support measures such as highly visible pictogram-based evacuation signs and pavement markings are considered effective. These tools are language-independent and involve relatively low costs for installation and maintenance, making them highly feasible even in diverse tourist settings where resources and infrastructure may vary.
Tourists, who are generally unfamiliar with the local geography, often do not recognize whether they are located within tsunami inundation zones, and their understanding of evacuation sites tends to be insufficient. Verbal evacuation guidance provided by residents is therefore regarded as a crucial means of supporting the evacuation of tourists. As illustrated by the “Kamaishi Miracle (Katada & Kanai, 2016; Ohsumi et al. 2019)”, verbal evacuation guidance has been shown to exert a more significant psychological effect than announcements disseminated through applications or outdoor speakers. This phenomenon can be attributed to the fact that individuals can physically observe the voices and figures of others fleeing, which serves as a more salient and impactful stimulus.
However, it is impossible to provide verbal evacuation guidance in areas where there are no residents, and it is unrealistic to expect residents to voluntarily evacuate, to reduce the risk of a disaster affecting the entire community, evacuation guidance must be provided in areas without residents. In such areas, highly visible evacuation signs (pictograms) and other means are necessary. When establishing these signs, focus on the temporal and spatial overlap between residents and tourists, and design and place them effectively.
This study aims to clarify the possibility of residents providing evacuation support to tourists in the event of a disaster by analyzing the spatial and temporal overlap between residents and tourists. This will provide basic knowledge for reconsidering evacuation guidance methods in areas and at times when evacuation support from residents cannot be expected and will contribute to the design of disaster mitigation plans and signage plans for tourist destinations.
The structure of this paper is as follows: Section 2 reviews previous studies and presents the position of the present study. Section 3 summarizes the target area for analysis and the outline of the data used. Section 4 clarifies the distribution of the population staying in the target area. Section 5 evaluates evacuation guidance based on the spatiotemporal overlap between residents and tourists using a niche overlap index. Finally, Section 6 discusses the results obtained and future issues. The sixth Section of the study presents the results obtained from research and discusses future issues that require attention.
2. Review of Previous Studies and Positioning of This Study
There are various methods for analyzing human overlaps. For example, there are methods to estimate and visualize spatial human flow density using kernel density estimation (Silverman, 1986), and methods to evaluate coexistence status and degree of concentration using Shannon entropy, an ecological diversity index (Lou, 2006). Kernel density estimation is a statistical method that allows for the evaluation of the spatial density of individual objects. However, it is challenging to demonstrate the overlap between different groups. Additionally, while the Shannon entropy index is capable of quantifying spatial diversity and dispersion, it is challenging to assess the strength of the overlap.
In the domain of mathematical ecology, or ecostatistics, the analysis of niche overlap, which examines the intersection of species’ distributions, has been a subject of study since the late 1950s. This field has witnessed the development of numerous overlap indices. In recent years, these indices have been applied to various fields, including biological approaches (Jiménez-Guevara et al., 2024; Shinohara, 2021), studies that evaluated the impact of human activities on local communities (Kajitani et al. 2002), and studies that used them to evaluate urban disaster risks (Okada & Maekawa, 1997).
In the fields of urban planning and transportation, the use of human flow data, which visualizes the movement of people and goods, can be used to provide public transportation services that meet the needs of users and to promote sustainable urban development and regional revitalization. In the field of disaster prevention, human flow data can be used to assess disaster risk and formulate evacuation plans and is becoming increasingly important.
In this study, we examine the “niche overlap index” from the perspective of evacuation support and analyze the overlap in the spatial and temporal distributions of residents and tourists. We believe this approach can evaluate the possibility of residents providing evacuation guidance to tourists and propose a new method for tourists’ preliminary risk assessment in the event of a tsunami.
3. Overview of Study Area and Data Used
3.1 Overview of Study Area
As illustrated in Fig. 1, Ishigaki Island and Miyako Island, the target areas of this study, are situated between Okinawa Island and Taiwan, thereby serving as geographical nodes that facilitate connectivity between Japan and Asia. The population of both islands is less than 50,000, and Ishigaki Island receives approximately 1.18 million tourists per year (Ishigaki city, 2023), while Miyako Island receives approximately 930,000 tourists (Miyakojima city, 2023).
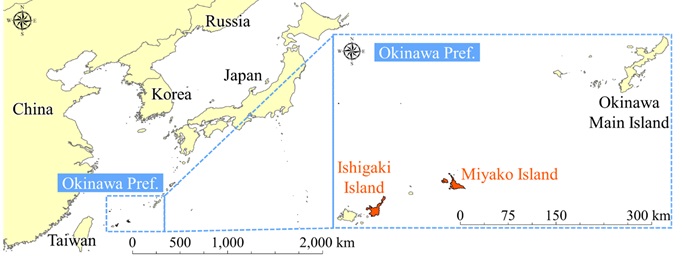
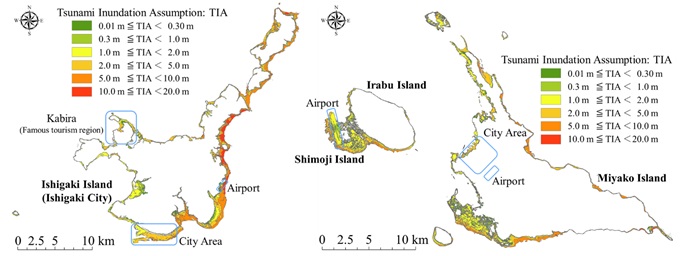
Table 1. Numbers of data and IDs
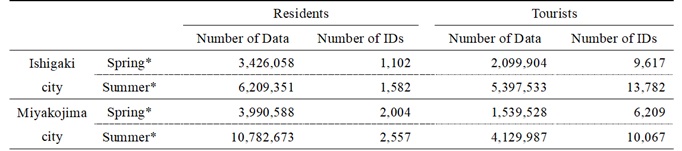
*Spring:2019.02.11~04.07 (56 days),Summer:2019.07.15~09.08 (56 days)
As illustrated in Fig. 2, the eastern coast of Ishigaki city is projected to experience inundation with a height exceeding 20 meters, encompassing the city center and the airport within the tsunami inundation zone. Furthermore, the minimum arrival time of the initial tsunami wave is estimated to be a mere five minutes (Okinawa Prefecture, 2015), underscoring the imperative for expeditious evacuation measures. Conversely, Miyakojima city has a limited area that is expected to be inundated with more than 10 meters of water compared to Ishigaki city. The urban area and the airport are located outside the expected inundation zone. The initial arrival time of the tsunami wave is estimated to be 16 minutes at its shortest, as reported by Okinawa Prefecture in 2015. The potential for damage is lower than that observed in Ishigaki city.
3.2 Overview of Data Used
The data used in this study were application location data provided by Blog Watcher, Inc., and were generated based on information obtained from the GPS capabilities of mobile phones and other devices (Blog Watcher Inc.).
These data were compiled and analyzed for each 500-m grid. The estimated residence of each island was assigned as a resident if inside the island and a tourist if outside the island, and the attribute information was assigned to each
island. A summary of these data is presented in Table 1. The number of networks analyzed was 1,011 in Ishigaki City and 895 in Miyakojima city.
4. Stay Population Analysis
4.1 Analysis by Season
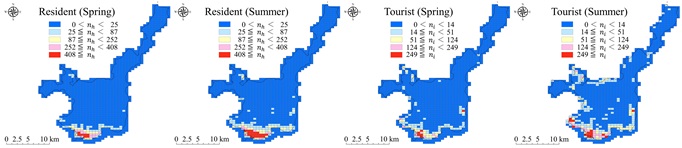
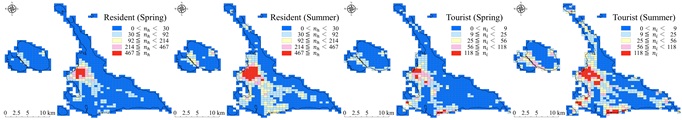
First, in order to clarify the seasonal differences in the population of residents on the two islands, the daily population of residents by season was calculated. As illustrated in Fig. 3, the distribution of the daily population is examined. A close examination reveals that the distribution of both residents and tourists varies according to the season. A comparison of Ishigaki city and Miyakojima city reveals that the former is particularly concentrated around the urban area, suggesting that tourists are widely distributed in both islands during the summer season.
4.2 Analysis by Time Zone
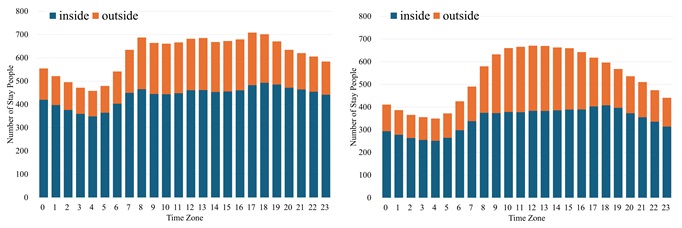
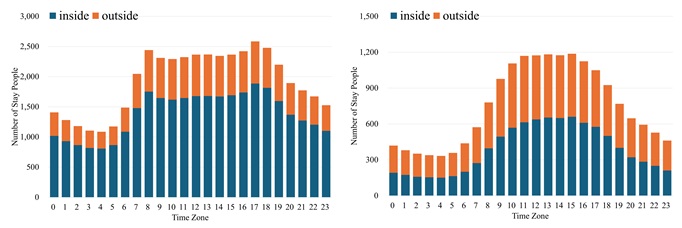
The population of the two islands by time of day is shown in Fig. 4 for Ishigaki city and Fig. 5 for Miyakojima city. Fig. 4 and 5 illustrate the population of Ishigaki city and Miyakojima city, respectively. A substantial proportion of the population -more than 70% of residents and tourists -resided within the tsunami inundation zone during all time periods. In Miyakojima city, the proportion of residents who remained within the tsunami inundation zone tended to be higher during the nighttime and early morning hours (21:00 to 7:00).
5. Niche Overlap Analysis
5.1 Evaluation Approach
If residents support the evacuation behavior of tourists, this study clarifies the time and areas where evacuation guidance becomes difficult.
In this study, we consider residents and tourists as different species in a tourist area and use the niche overlap index , which is an index of the spatiotemporal overlap of people, to evaluate the risk of tsunami damage to tourists. The index is expressed by the following equations (1)-(3).

where, nh represents the number of residents and ni represents the number of tourists, j=1⋯ L represents space, and t =1⋯ M represents time. This index takes values between 0 and 1. Using these indexes, we evaluate the risk of tsunami damage based on the overlap between residents and tourists. A large overlap means that the number of residents and tourists is similar, and thus evacuation guidance is possible; a small overlap means that evacuation guidance by residents is difficult due to a bias toward one side or the other.
5.2 Analysis of Spatial Overlap
In this section, the overlap between residents and tourists for each mesh is clarified.
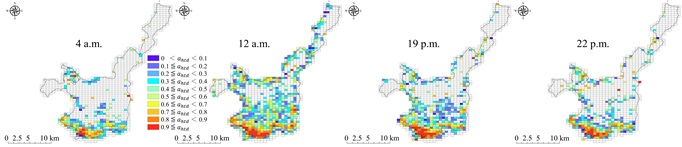
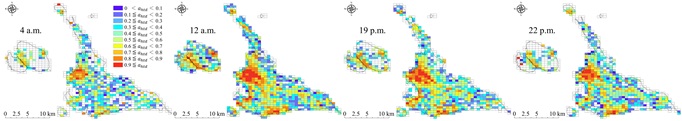
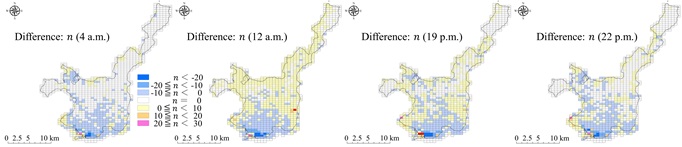
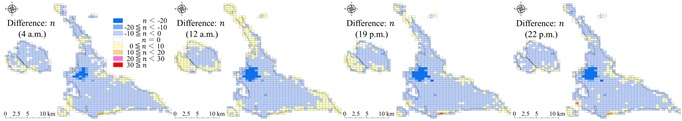
The niche index values were calculated at 4:00 (early morning), 12:00 (noon), 19:00 (evening), and 22:00 (night) for the summer holidays, when many both residents and tourists were observed. Fig. 6 presents the distribution map of the index calculation results, while Fig. 7 illustrates the discrepancy in the number of residents and tourists. The indexes are expressed by the following equations (4)-(6).


where, nh represents the number of islanders, ni represents the number of tourists, j=1⋯ L represents the space, and d=1⋯ D represents the date.
The overlap was high in Ishigaki city because most of the residents stayed within the tsunami inundation zone at any time of the day, while most of the residents stayed outside the tsunami inundation zone in Miyakojima city. In Ishigaki city, the overlap was high in the southern part of the island and low in the central and northern parts, while in Miyakojima city, the overlap was high throughout the island.
In the “Kabira” district in the northwestern part of Ishigaki Island, which is famous as a tourist destination, the number of residents was higher during the evening and early morning hours, while the number of tourists was higher during the daytime hours. At Shimoji Airport on Shimoji Island, the number of tourists was higher from noon to evening. This is thought to be because many tourists visit the airport during the daytime and the airport is in operation, while tourists visit lodging facilities and the city center during the nighttime.
5.3. Considerations for Disaster Mitigation
The results of the previous section index that more tourists than residents stay in the central and northern part of Ishigaki city, and that the overlap of tourists and residents is small during most of the time. This indicates that it is difficult to expect residents to evacuate tourists in this area.
In places where the overlap between residents and tourists is small, it is not realistic to expect residents to go to the tourists and guide them to evacuate in the event of a disaster. In addition, multilingual audio announcements can be difficult to understand even during normal times, and the more languages that are available, the longer it takes to convey information. Therefore, in such areas, physical support measures such as highly visible signs, road surface markings, and pictograms can be effective evacuation guidance measures for tourists, rather than relying on human assistance.
In certain areas, such as the “Kabira” district in the northwestern part of Ishigaki city and “Shimojijima Airport” on Shimojijima Island, the overlap between residents and tourists varied significantly depending on the time of day. In such areas, it is necessary to flexibly change the priority of evacuation support according to the time of day to increase the effectiveness of evacuation support. Specifically, during the day when tourists concentrate on tourist attractions and airports, the evacuation support should be given priority to the areas around these facilities. Conversely, the period from late at night to early in the morning is characterized by a higher propensity among tourists to patronize lodging facilities, thereby augmenting the necessity for the provision of evacuation support in the surrounding areas. Consequently, the provision of evacuation support in tourist areas must be informed not only by spatial considerations but also by temporal shifts.
6. Conclusion
This study aimed to clarify the possibility of residents assisting tourists with evacuation during disasters. To this end, we conducted a population retention analysis using app location data in Ishigaki City and Miyakojima City in Okinawa Prefecture. We focused on the distribution of residents and tourists by time and region, as well as the overlap between them, to evaluate the possibility of residents guiding tourists to evacuation sites and to consider the priority of evacuation assistance.
The analysis using the niche overlap index revealed that Ishigaki City faces a higher tsunami disaster risk than Miyakojima City. It also identified times and areas with little overlap between residents and tourists, indicating times and areas where providing evacuation support would be challenging. In these areas, establishing physical support measures, such as highly visible signs and road markings, is important. This study’s methodology is an effective means of pre-evaluating the possibility of providing evacuation support, and it is believed to have provided useful information for developing disaster mitigation and signage plans in tourist areas.
In future analysis, we will consider land use and facility placement, and we will also examine the applicability of this model in other regions.
Author Contributions
Conceptualization, D.K. and A.U.; methodology, D.K.; writing—original draft preparation, D.K. and A.U.; writing—review and editing, D.K. and A.U.; project administration, D.K.; funding acquisition, D.K.
All authors have read and agreed to the published version of the manuscript.
Funding
This research was supported by the Japan Society for the Promotion of Science (JSPS) Grants-in-Aid for Scientific Research (JP22H00222, JP23H00197, and JP24K15538).
Conflicts of Interest
The authors declare no conflict of interest.
References:
Beirman, D. (2020). Restoring tourism destinations in crisis: A strategic marketing approach. doi:10.4324/9781003117148
Blog Watcher Inc. https://www.blogwatcher.co.jp/ (accessed 2021.01.01)
Glaesser, D. (2006). Crisis management in the tourism industry.
Jiménez-Guevara, C.D. et al. (2024). Geographical and ecological allopatry effects on niche change in two sister species pairs of hummingbirds in western North America, Journal of Arid Environment, 224. https://doi.org/10.1016/j.jaridenv.2024.105236
Kajitani, Y. et al. (2002). Spatial Temporal Analysis of Human Activity Distribution in Disaster Recovery Processes, Infrastructure Planning Review, 19(2). (in Japanese)
Katada, T. & Kanai, M. (2016), The Schol Education to Improve the Disaster Response Capacity: A Case of “Kamaishi Miracle”, Journal of Disaster Research, 11(5), pp. 845-856. https://doi.org/10.20965/jdr.2016.p0845
Kawata, Y. (2005). Sumatra-Andaman Islands Earthquake of 26 December 2004, Annuals of Disas. Prev. Res. Inst., Kyoto Univ., 48 A. (in Japanese)
Lou, J. (2006). Entropy and diversity, OIKOS, 13(2). https://doi.org/10.1111/j.2006.0030-1299.14714.x
Miyakojima City (2023). Number of Tourists entering the area, https://www.city.miyakojima.lg.jp/gyosei/toukei/kankouyaku.html (in Japanese, accessed 2024.10.10)
Ohsumi, T. et al. (2019). Damage Related to the 2011 Tohoku Earthquake in and Around Kamaishi City- Beyond the Tsunami Disaster-, Journal of Disaster Research, 14(9), pp. 1185-1200. https://doi.org/10.20965/jdr.2019.p1185
Okada, N. & Maekawa, K. (1997). Niche Analysis Applied to Assessment of Urban Disaster Risk – A Basic Approach, Annuals of Disas. Prev. Res. Inst., Kyoto Univ., 40 B-2. (in Japanese)
Okinawa Prefecture (2015). About Okinawa Tsunami inundation assumption, https://www.pref.okinawa.jp/bosaianzen/bosai/1003500/1020541.html (in Japanese, accessed 2022.01.01)
Omori, H. et al. (2017). Human Response to Emergency Communication: A Review of Guidance on Alerts and Warning Messages for Emergencies in Buildings, Fire Technology, 53, pp. 1641-1668. doi:10.1007/s10694-017-0653-3
Shinohara, N. & Yamamichi, M. (2021). A modern synthesis of coexistence mechanisms in community ecology, Japanese Journal of Ecology, 71, pp. 39-63. https://doi.org/10.18960/seitai.71.2_35 (in Japanese)
Silverman, B. W. (1986). Density estimation for statistics and data analysis, Monographs on Statistics and Applied Probability, https://ned.ipac.caltech.edu/level5/March02/Silverman/paper.pdf
Relevant Articles
-

Accuracy of peripheral oxygen saturation (SpO₂) at rest determined by a smart ring: A Study in Controlled Hypoxic Environments
by Yohei Takai - 2025,6
VIEW -
An attempt to realize digital transformation in local governments by utilizing the IT skills of information science students
by Edmund Soji Otabe - 2025,4
VIEW -
Fundamental Study on Detection of Dangerous Objects on the Road Surface Leading to Motorcycle Accidents Using a 360-Degree Camera
by Haruka Inoue - 2025,S1
VIEW -
Wildlife Approach Detection Using a Custom-Built Multimodal IoT Camera System with Environmental Sound Analysis
by Katsunori Oyama - 2025,S2
VIEW