

Search for Articles
Development of Laser Scanner Units for UAV
Journal Of Digital Life.2023, 3,8;
Received:April 2, 2023 Revised:April 27, 2023 Accepted:June 5, 2023 Published:August 3, 2023

- Shigenori Tanaka
- Faculty of Informatics, Kansai University
- Ryuichi Imai
- Faculty of Engineering and Design, Hosei University
- Kenji Nakamura
- Faculty of Information Technology and Social Sciences, Osaka University of Economics
- Yuhei Yamamoto
- Faculty of Environmental and Urban Engineering, Kansai University
- Yoshinori Tsukada
- Faculty of Business Administration, Setsunan University
- Masaya Nakahara
- Faculty of Information Science and Arts, Osaka Electro-Communication University
Correspondence: nakahara@oecu.jp
Abstract
In its i-Construction policy, the Ministry of Land, Infrastructure, Transport and Tourism has stipulated a manual for public surveying using by UAV photogrammetry with the aim of improving productivity at construction sites. However, UAV photogrammetry requires a huge amount of time to generate point cloud data from photographs, causing a problem that it is difficult to monitor the daily progress of the construction site. There is another problem that it is incapable of taking measurements except daylight hours.
Against this backdrop, we have been developing laser scanner units for UAV equipped with LiDAR, IMU and GNSS receiver. Then, we clarified the error factors that are expected to affect the precision prescribed of point cloud data and summarized the requirements for the onboard equipment and the method of generating point cloud data. However, we have not yet proposed nor developed the laser scanner units as well as for generating point cloud data considering these requirements. Thus, in this paper, we developed the laser scanner units and a new method for generating point cloud data within the laser scanner units to optimize the error factors based on these requirements clarified in the existing study.
1. Introduction
UAVs (Unmanned Aerial Vehicles) are used for various usages such as monitoring the progress of construction sites or grasping the situation during disasters. In its i-Construction policy, the Ministry of Land, Infrastructure, Transport and Tourism has stipulated a manual for public surveying using UAVs (draft) (Ministry of Land, Infrastructure, Transport and Tourism. 2017b) with the aim of improving productivity at construction sites. This manual stipulates how to generate 3D point cloud data (hereinafter referred to as “point cloud data”) by UAV photogrammetry. However, UAV photogrammetry requires a huge amount of time to generate point cloud data from photographs, causing a problem that it is difficult to monitor the daily progress of the construction site. There is another problem that it is incapable of taking measurements except daylight hours.
To address these problems, use of a UAV-mounted laser scanner equipped with LiDAR (Light Detection And Ranging), which is less sensitive to light intensity and capable of measuring point cloud data in a short time, has been examined. In 2017, the precision prescribed for monitoring daily progress as well as construction management such as the work progress using this equipment (Ministry of Land, Infrastructure, Transport and Tourism. 2017a) has been determined. However, in order to satisfy the precision prescribed, it is necessary to clarify the characteristics of the on-board equipment that affect the precision, the measurement conditions that consider the site conditions, and the method of generating optimal point cloud data.
Against this backdrop, existing studies have proposed a method using SLAM (Simultaneous Localization and Mapping) (Sofonia, J., et al. 2019) and another method using IMU (Inertial Measurement Unit) and GNSS (Global Navigation Satellite System) (Elamin, A., et al. 2022). The method using SLAM uses feature points in point cloud data to estimate and correct deviations in relative positions and tilts between point cloud data measured at different times. However, the road and river embankment sites have a uniform shape in the longitudinal direction of the embankment, and there are few features. As there are few features in road and river construction sites, the relative position and tilt deviation between point cloud data is misestimated when the method using SLAM is applied. In contrast, when the method using GNSS and IMU is applied, the position and attitude of the aircraft can be measured and corrected regardless of the presence or absence of features. Therefore, at a construction site, the method using IMU and GNSS can generate the point cloud data of the entire measurement object with high accuracy.
We have been developing laser scanner units for UAV equipped with LiDAR, IMU and GNSS receiver (Tanaka, S., et al. 2019). Then, we clarified the error factors that are expected to affect the precision prescribed of point cloud data and summarized the requirements for the onboard equipment and the method of generating point cloud data. However, we have not yet proposed nor developed the laser scanner units as well as for generating point cloud data considering these requirements. Thus, in this paper, we developed the laser scanner units and a new method for generating point cloud data within the laser scanner units to optimize the error factors based on these requirements clarified in the existing study. Then, we evaluate the usefulness of the developed laser units by comparing it with the precision required at the construction sites.
2. Problems and Development of Existing Equipment
2.1. Problems of the existing laser scanner units
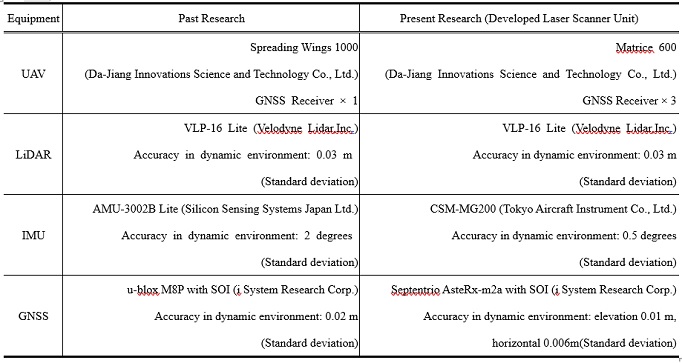
Table 1 lists the components of the laser scanner units in the existing study (Tanaka, S., et al. 2019). In the existing study, AMU-3002B Lite was used as the IMU. In dynamic environments, such as during UAV flights, the dynamic accuracy of this IMU is less than 2 degrees. However, the internal time of the connected PC is given for the measurement time of this equipment, while the time of the atomic clock of the GNSS satellite (hereinafter referred to as GNSS time) is given to the other LiDAR and GNSS receivers. A problem has come to light that small errors occur between these times, causing the precision of point cloud data generation to decline. In addition, it has also been found that the measuring precision in the direction of elevation is not sufficient based on the precision prescribed in the Guidelines for Work Progress Management (Dekigata Kanri Yoryo) (Ministry of Land, Infrastructure, Transport and Tourism. 2017a).
Table 1. Specifications of equipment in past and present research
2.2. Development of the laser scanner units
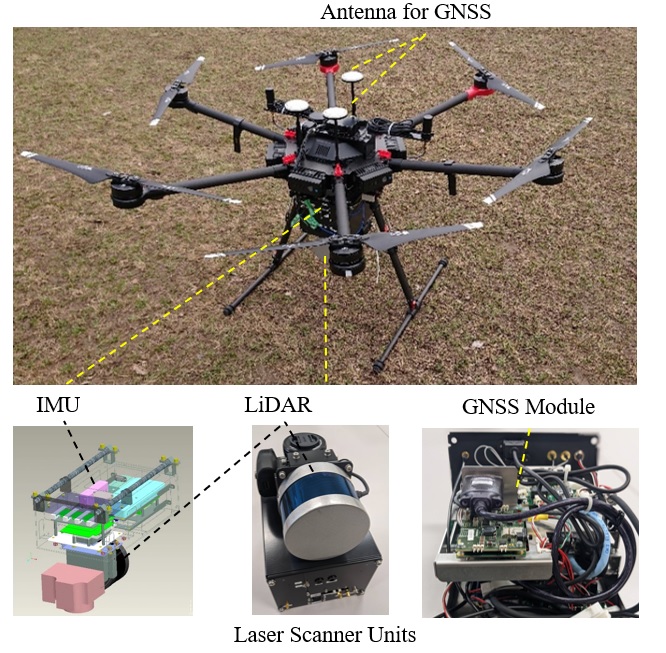
First, to address the first concern, we adopted the CSM-MG200 made by Tokyo Aircraft Instruments Co., Ltd. as an IMU that is capable of adding GNSS time as the measurement time. In dynamic environments, the dynamic accuracy of this IMU is less than 0.5 degrees. To address the second issue, we adopted the Septentrio AsteRx-m2a with SOI made by i-Systems Research Inc., having a positioning accuracy with a standard deviation of 0.01 m in the vertical direction and 0.006 m in the horizontal direction, as the GNSS receiver. As this GNSS can measure with a dynamic accuracy of 0.01 m or more compared to the GNSS used in existing studies, higher accuracy can be expected in dynamic environments, such as during a UAV flight. In the previous study (Tanaka, S., et al. 2019), furthermore, the point cloud data was generated by using only the data measured at stable flight attitude to achieve high precision. For this purpose, we adopted Matrice 600, which is the successor to the UAV adopted in the previous study. This UAV is equipped with more GNSS receivers than the Spreading Wings 1000, enabling more stable flight. In this study, we developed the laser scanner units as shown in Fig. 1 using these newly adopted devices and Velodyne’s VLP-16 Lite. As in the previous study, the tilt of the body (Roll angle and Pitch angle) is measured by the IMU, and the nose direction (Yaw angle) is measured by two GNSS antennas. This arrangement is expected to be able to measure with higher accuracy than existing approaches while the UAV is in flight.
3. Problems of the Existing Method and Solutions
3.1. Problems of the existing method of generating point cloud data within laser scanner units
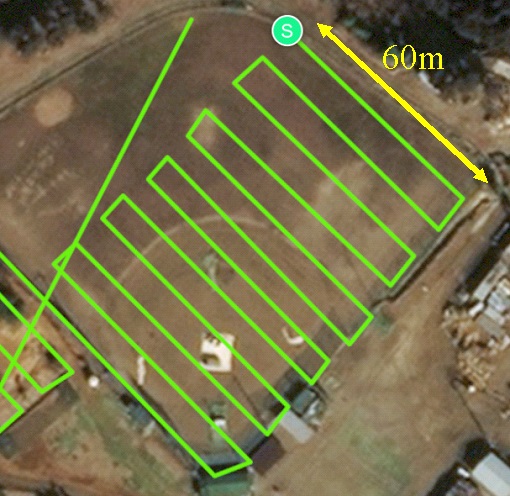
In the evaluation experiment of the existing study, we clarified three problems in the existing method of generating point cloud data (Nagai, M., et al. 2009, Wallace, L., 2012, Martin, C., 2017). The first problem is that the measuring precision declines when the flight speed is not stable. In the measurement by the laser scanner units, it flies as shown by the green line in Fig. 2.
In this case, the UAV pauses at each turnaround point. It accelerates and decelerates immediately before and after the pause, and the measurement data measured during the acceleration and deceleration contain many errors.
The second problem is that the measured position of the GNSS receiver is used as it is, which causes deviation in the vertical direction. The measured values of the GNSS receiver deviate as much as the amount of the measuring precision. Therefore, measurement errors occur in all the points of the point cloud data measured by LiDAR corresponding to the measuring precision. However, it is expected that not only the GNSS receiver but also IMU similarly cause a deviation for the amount of the measuring precision, allowing the similar problem to occur.
The third problem is that the generating precision of point cloud data declines due to the inclusion of points where the distance to the object is far and the incident angle of the laser beam is low. In measurements by the laser scanner units, data measured along near and far straight flight routes from the measurement point are mixed, and the generating precision of point cloud data is reduced, as shown by the green line in Fig. 2.
3.2. Solutions for the problems
The first problem is addressed by not using the measurement data during acceleration and deceleration for generating point cloud data. The second problem is addressed by using a reference point for adjustment to make correction. In aerial laser surveying and UAV laser surveying, the elevation is obtained using GNSS observation results. Thus, an adjustment reference point (hereafter referred to as “adjustment point”) is set at a flat location where there is nothing around that obstructs the sky. Subsequently, the deviation of the point cloud data in the direction of elevation is adjusted (Ministry of Land, Infrastructure, Transport and Tourism. 2017b) according to the adjustment point and resolved. At this time, multiple adjustment points are set to prepare the plane for adjustment (hereinafter referred to as the “adjustment plane”), in order to correct the deviation caused by IMU similarly as well as the GNSS receiver. The problem can be solved by correcting the tilt of the measurement data according to this adjustment plane. The third problem is addressed by removing the point cloud data with low generation precision.
4. Proposal for a Method of Generating Point Cloud Data within Laser Scanner Units
4.1. Overview of the method of generating point cloud data within laser scanner units
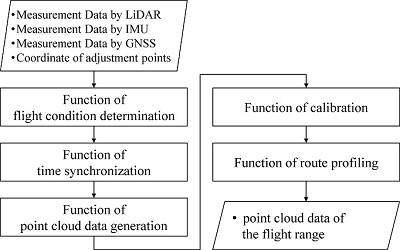
In this paper, we propose a method of generating point cloud data to solve the problems of the existing method, using the measurement data of the developed laser scanner units. Fig. 3 shows the flow of the developed method within laser scanner units. The method is composed of the functions of flight condition determination, time synchronization, point cloud data generation, calibration, and the route profiling. The method allows generation of point cloud data of the flight range based on the location information of the adjustment points, from the data measured by LiDAR, IMU, and the GNSS receiver mounted on the laser scanner units.
4.2. Function of flight condition determination
This function is used to determine and extract the data measured during a uniform linear flight. Specifically, the movement trajectory of only the Fix solution is obtained from the GNSS receiver. The flight speed is calculated from the movement trajectory, and only the measurement data of each device during the uniform linear flight is extracted for further processing.
This function solves the first problem of the existing method.
4.3. Function of time synchronization
This function is used to synchronize the times of measurement data obtained by LiDAR, IMU and the GNSS receiver during a uniform linear flight extracted by the function of flight condition determination. In specific, based on the GNSS time of each device, the IMU measurement data measured at the closest time in each LiDAR measurement point is synchronized as data measured at the same time. The location information obtained by the GNSS receiver is calculated by linear interpolation from the pre- and post-data measured at the closest time to the current time and synchronized.
4.4. Function of point cloud data generation
This function is used to generate point cloud data using the measurement data of LiDAR, IMU, and the GNSS receiver synchronized by the time synchronization process. In specific, it performs rigid-body conversion to the coordinate system based on latitude, longitude, and elevation for each 3D measurement point by LiDAR using the Roll and Pitch angles by IMU and latitude, longitude, elevation and Yaw angle by GNSS receiver. Then, point cloud data is generated by superimposing all the points after the rigid-body conversion.
4.5. Function of calibration
This function is used to correct the measurement errors caused by IMU and the GNSS receiver, using the pre-measured adjustment plane. First, the point cloud data after rigid body conversion is divided in units of LiDAR measurement frame. In the case of LiDAR used in this paper, the time required for one round of measurement is 0.1 second; therefore, the point cloud data is divided in units of 0.1 second. Next, the point cloud data for the frame measuring the adjustment plane is obtained. Then, an approximate plane is generated in the point cloud data, which is corrected according to the angle of the adjustment plane. At this time, other frames are also corrected at the same angle. Finally, the height of the point cloud data is corrected according to the elevation values of the constituent points of the adjustment plane. The point cloud data of the other frames are repeatedly corrected so that the elevation values within the range of overlapping with the point cloud data after correction can agree with each other. This function solves the second problem of the existing method.
4.6. Function of route profiling
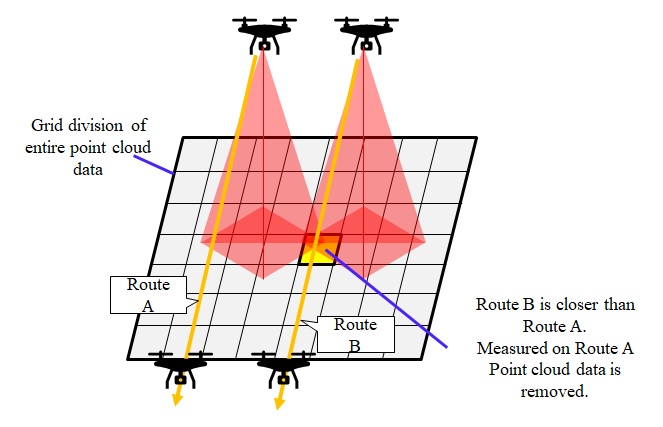
This function is used to do filtering by removing the data other than the point cloud data measured from the flight route that is close from the measurement point. Fig. 4 shows the image of this process. First of all, the entire point cloud data is divided into grids of a certain size. Next, the nearest route flown in uniform linear motion is searched for each grid. Then, by eliminating the point cloud data measured from those other than the searched route, only the point cloud data with close measurement distance and high incident angle is extracted. This function solves the third problem of the existing method.
5. Verification Experiments
5.1. Experiment overview
In this experiment, we confirmed the usefulness of a developed laser scanner unit by using it to measure the Nomac Drone Field in Nose-cho, Toyono-gun, Osaka, as shown in Fig. 2. The flight route was set to the route shown by the green line in Fig. 2, and the flight speed was set to 4 m/s. The adjustment plane was measured by network-type RTK positioning. The network-type RTK positioning was performed using a PENTAX G3100 R2. The usefulness of the laser scanner unit was evaluated by comparison with the point cloud data with the most probable values. The most probable values were measured using a ground-based laser scanner, PENTAX S-3180.
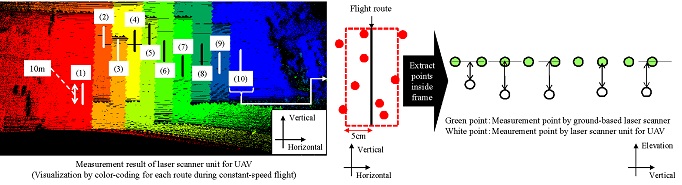
5.2. Evaluation method
In this experiment, the usefulness of developed laser scanner unit is evaluated by the difference in elevation between the most probable value and the point cloud data by the laser scanner unit. Fig. 5 shows an image of the evaluation method. First of all, both point cloud data right under the route by each route during uniform flight are extracted for the period of 10 minutes (Upper part of Fig. 5). Next, among the obtained point cloud data, the point cloud data for which the vertical distance from the flight route to the horizontal direction is within 0.05m is extracted (lower left part of Fig. 5). Then, the two nearest points with the most probable value from the extracted laser scanner unit points are selected. Finally, the vertical distance from the line segment connecting the two selected points to the laser scanner unit point is calculated, and the difference in elevation between the most probable value and the point cloud data obtained by the laser scanner unit is evaluated from their maximum, minimum, mean and standard deviation.
The evaluation targets are set to the ten points from (1) to (10) in Fig. 5. As in a previous study (Nagai, M., et al. 2009), the elevation difference between measurement point by ground-based laser scanner and laser unit for UAV under 0.05 m is evaluated as A, more than 0.05 m and under 0.10 m as B, more than 0.10 m and under 0.15 m as C, and 0.15 m or more as D, with reference to the precision confirmation standard of the groundwork survey and the workpiece measurement specified in the Guidelines for Work Progress Management (Ministry of Land, Infrastructure, Transport and Tourism. 2017a).
However, the ranges of these evaluation targets are not necessarily horizontal planes. Therefore, using the point cloud data of the most probable values, the unevenness of the evaluation range is evaluated by the standard deviation in the elevation direction at the same time as the evaluation of the difference in elevation mentioned above.
5.3. Evaluation results and discussion
Fig. 6 shows the point cloud data with the most probable value obtained by the ground-based laser scanner, and Fig. 7 shows the point cloud data obtained by the laser scanner units for UAV. The point cloud data from the UAV-mounted laser scanner was visualized by color-coding for each flight route filtered by the route profiling function. The point cloud data indicates that both of them were able to measure fences and vehicles within the measurement range.
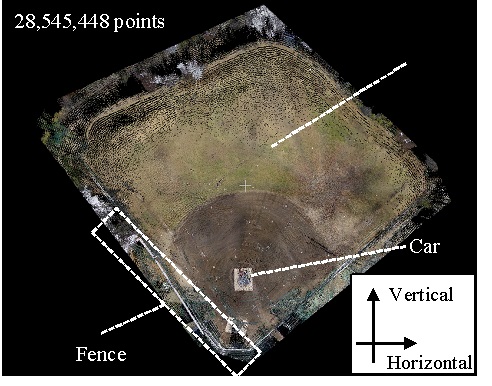
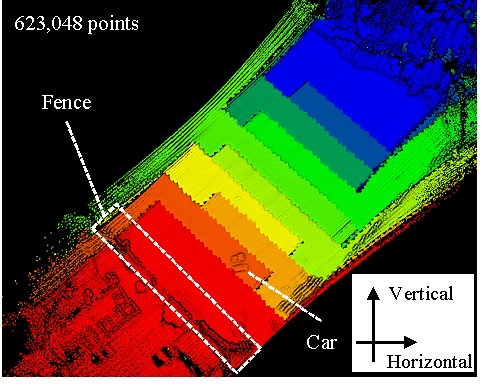
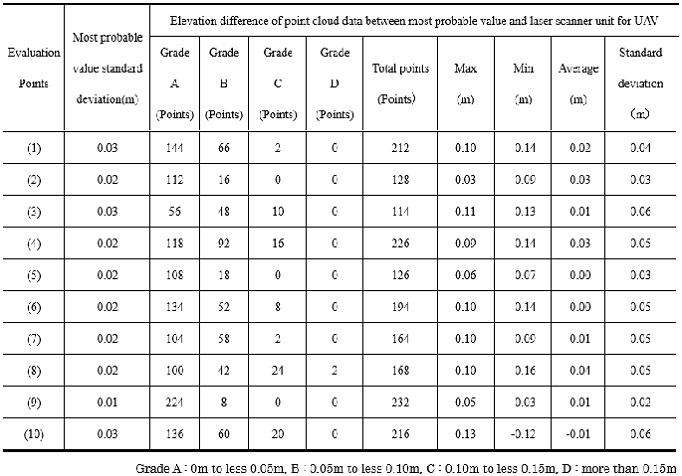
Table 2 presents the evaluation results, and Fig. 8 shows an example of elevation points (1). The standard deviation of the most probable value shows that there is a standard deviation of 0.01–0.03 m in Table 2. The target field has some areas with thick undergrowth. Therefore, not only the thickness of the ground surface but also the height of the undergrowth is generated in Fig. 8.
When we check the scores from Grade A to D, we can see that more than 80% to 90% of the scores are A and B evaluations. When we check the average difference in elevation, we can see that they are all within 0.03m. Considering that the measuring precision of LiDAR shown in Table 1 is 0.03m in standard deviation, it is considered that the measurement is successfully made with the measuring precision of the device.
On the other hand, the standard deviation of the difference in elevation is within the range of 0.02 m to 0.06 m. The LiDAR measurement points have errors not only in the elevation direction but also in the horizontal direction. If the standard deviation of the most probable value is also taken into account, it is estimated that the unevenness of the ground surface and undergrowth at the location where the displacement occurred affects the standard deviation of the difference in elevation. Considering the below, it can be inferred that the difference in elevation between the most probable value and the point cloud data obtained using the laser scanner unit is successfully measured within the range of the measuring precision of the devices. Considering that the standard deviation of the height difference was in the range of 0.11–0.12 m in the previous study, it is considered that the proposed technology improved the accuracy by 0.05 m or more.
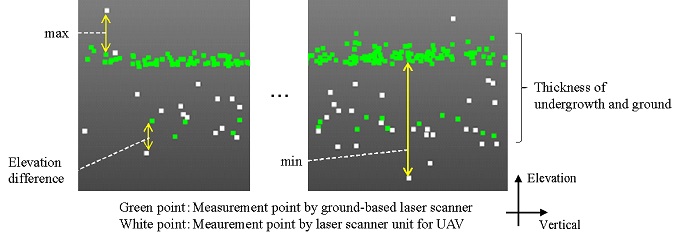
Table 2. Evaluation results
From these points, it was confirmed that the calibration function of the laser scanner unit allows the measurement errors of the GNSS receiver and IMU to be corrected, and that the measurement is possible within the range of measurement error of LiDAR only. In addition, it was also confirmed that the measurement errors caused by acceleration/deceleration of the UAV and measurement errors due to the mixture of measurement data from distant flight routes were also eliminated by the functions of flight condition determination and route profiling. Consequently, it was confirmed that the laser scanner unit is capable of solving the three problems of the existing UAV-mounted laser scanner and the existing method (Nagai, M., et al. 2009, Wallace, L., 2012, Martin, C., 2017).
6. Conclusion
In this paper, based on the problems of the existing laser scanner units and the existing method (Nagai, M., et al. 2009, Wallace, L., 2012, Martin, C., 2017) identified in the existing study (Tanaka, S., et al. 2019), we developed the laser scanner unis for UAV and new method of generating point cloud data within the laser scanner units to solve the problems. Then, from the results of the verification experiments, we confirmed the usefulness of the developed laser scanner units and the method within laser scanner units. However, since the precision prescribed in the Guidelines for Work Progress Management (Ministry of Land, Infrastructure, Transport and Tourism. 2017a) is within the range of 0.02m in the difference in elevation, 0.04m in mechanical surveying, and 0.06m in piecework measurement, further improvement in precision is necessary. Since the remaining error in this paper is the measurement error of LiDAR, it is necessary to examine a method of reducing the error of LiDAR. To do so, further improvement in precision can be expected by applying not only the results of attitude measurement by IMU and the GNSS receiver but also combining LiDAR, which is utilized in the robotics community, and SLAM, which is a self-position estimation method using cameras, to correct the errors. In the future, we plan to develop laser scanner units those also combines SLAM (Li, R., 2014) to make them more applicable to actual sites. This paper was translated and written based on the technical report published by the Image Lab (Kubota, S., et al. 2023).
Author Contributions
Conceptualization, S.T.; methodology, Y.Y., Y.T. and M.N.; software, M.N.; validation, M.N.; formal analysis, Y.Y., Y.T. and M.N.; investigation, Y.Y., Y.T. and M.N.; resources, R.I. and K.N.; data curation, M.N.; writing—original draft preparation, Y.Y., Y.T. and M.N.; writing—review and editing, R.I. and K.N.; visualization, M.N.; supervision, S.T.; project administration, R.I. and K.N.; funding acquisition, R.I. and K.N.;
Funding
This research was funded by Asia Air Survey Co., Lid., FORUM 8 Co., Ltd., Intelligent Style Co., Ltd., Mitsubishi Electric Engineering Co., Ltd., PASCO Corp. and ZENRIN CO., LTD.
Acknowledgments
This study was partially performed under Kansai University Kaiser Project S “Consortium for the Development of Advanced Spatial Measurement Technology” and the Ministry of Land, Infrastructure, Transport and Tourism’s Grant for Research and Development of Construction Technology “Research and Development on Utilization of Measurement Data Using UAV with Laser Scanner for Construction Management of River Earthworks”. We would like to express our gratitude for their support.
Conflicts of Interest
The authors declare no conflict of interest.
References
Elamin, A. (2022). A GNSS/INS/LiDAR Integration Scheme for UAV-Based Navigation in GNSS-Challenging Environments. Sensors, 22(24), 1-15.
Kubota, S., et al.(2023). Development of UAV-mounted Laser Scanner Unit and Point Cloud Data Generation Method. Image Lab, 34(2), 19-25.
Li, R., et al.(2014). LiDAR/MEMS IMU Integrated Navigation (SLAM) Method for a Small Uav in Indoor Environments. Inertial Sensors and Systems Symposium 2014, 1(1), 1-15.
Martin, C., et al.(2017). Designing and Testing a UAV Mapping System for Agricultural Field Surveying. Sensors, 17(12), 2703-2722.
Ministry of Land, Infrastructure, Transport and Tourism. (2017a). Guidelines for Work Progress Management using Unmanned Aerial Vehicle-mounted Laser Scanner (Earthworks) (Draft). http://www.hrr.mlit.go.jp/gijyutu/i_Construction/youryou_kijun/11kisaikensa/11_9_ koukuureza_dekidaka_doko.pdf.
Ministry of Land, Infrastructure, Transport and Tourism. (2017b). Public Survey Manual using UAV (Draft). https://www.gsi.go.jp/common/000186712.pdf.
Nagai, M., et al.(2009). UAV-borne 3-D Mapping System by Multisensor Integration. Transactions on Geoscience and Remote Sensing, 47(3), 701-708.
Sofonia, J., et al.(2019). Observing Geomorphological Change on an Evolving Coastal Sand Dune Using SLAM-Based UAV LiDAR. Remote Sensing in Earth Systems Sciences, 25(2), 273-291.
Tanaka, S., et al.(2019). A Study on Measurement Method and Measurement Error using UAV-mounted Laser Scanner for Construction Management of Earthworks. Journal of Japan Society of Civil Engineers, Ser. F3 Civil Engineering Informatics, 74(2), l_125- l_135.
Wallace, L., et al.(2012). Development of a UAV-LiDAR System with Application to Forest Inventory, Photogrammetry and Remote Sensing, 4(6), 1519-1543.
Relevant Articles
-

Accuracy of peripheral oxygen saturation (SpO₂) at rest determined by a smart ring: A Study in Controlled Hypoxic Environments
by Yohei Takai - 2025,6
VIEW -
An attempt to realize digital transformation in local governments by utilizing the IT skills of information science students
by Edmund Soji Otabe - 2025,4
VIEW -
Fundamental Study on Detection of Dangerous Objects on the Road Surface Leading to Motorcycle Accidents Using a 360-Degree Camera
by Haruka Inoue - 2025,S1
VIEW -
Wildlife Approach Detection Using a Custom-Built Multimodal IoT Camera System with Environmental Sound Analysis
by Katsunori Oyama - 2025,S2
VIEW