

Search for Articles
Measurement of Motor-vehicle Traffic Volume Using Camera Images and Artificial Intelligence
Journal Of Digital Life.2023, 3,4;
Received:June 5, 2022 Accepted:July 20, 2022 Published:February 21, 2023

- Ryuichi Imai
- Faculty of Engineering and Design, Hosei University
- Daisuke Kamiya
- Faculty of Engineering, University of the Ryukyus
- Yuhei Yamamoto
- Faculty of Environmental and Urban Engineering, Kansai University
- Wenyuan Jiang
- Faculty of Engineering, Osaka Sangyo University
- Masaya Nakahara
- Faculty of Information Science and Arts, Osaka Electro-Communication University
- Koki Nakahata
- Graduate School of Informatics, Kansai University Graduate School
- Shigenori Tanaka
- Faculty of Informatics, Kansai University
Correspondence: ryuichi.imai.73@hosei.ac.jp
Abstract
In Japan, road traffic censuses are conducted to assess road traffic conditions. Recently, techniques for counting traffic volume from video images have been attracting considerable attention in order to improve work efficiency and save labor, and a large number of technologies have been developed. However, since traffic volume surveys are often conducted 24 hours a day, day and night, at various sites and under various weather conditions, existing technologies have yet to reach the counting accuracy required in practice. The authors aim to develop techniques for traffic volume surveys applicable in practice by applying artificial intelligence. This paper reports the results of a case study in which the proposed techniques were applied to the video taken during actual traffic volume surveys.
1. Introduction
Road administrators conduct motor-vehicle traffic surveys for road maintenance and management. In these surveys, surveyors visually inspect the vehicles passing through the road, classify large and small vehicles based on their size and license plate numbers, and count the number of the passing vehicles. They are conducted over a long period of time, day and night for 12 or 24 hours a day, and at the same time at multiple locations. Therefore, with the recent decline in the working-age population, securing surveyors has become a serious problem, and more efficient and labor-saving survey work is expected.
Against this background, the Ministry of Land, Infrastructure, Transport and Tourism (MLIT) is considering survey methods using general-purpose video cameras or monitoring cameras for road management (CCTV: closed-circuit television), eliminating manual surveys by surveyors. Among these, development of an AI traffic volume survey, which automates the survey by analyzing video images, is being progressed with particular focus because it enables continuous monitoring by automatically analyzing video images. Recently, many techniques and services have been developed for practical use for counting the number of vehicles passing by vehicle type (small- and large-size vehicles) using artificial intelligence (AI) to analyze video images. However, since traffic volume surveys of motor-vehicles are conducted day and night at various sites under diverse weather conditions, existing techniques have a problem that they haven’t reached the counting accuracy required for practical use yet.To address such a problem, we have applied artificial intelligence to develop techniques for traffic volume surveys of motor-vehicles applicable in practice. This paper reports the results of a case study in which the proposed technique is applied to the camera images taken in a practical motor-vehicle traffic survey.
2. Overview
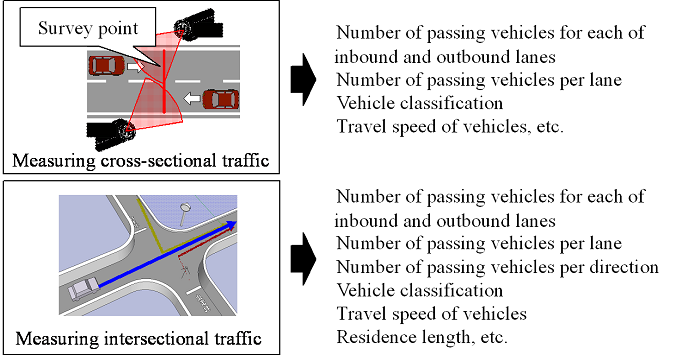
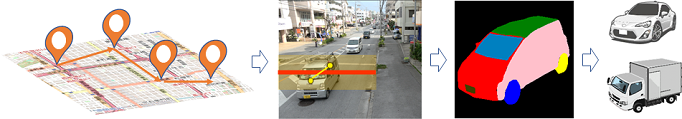
The overview of this study is shown in Figure 1. The road administrator surveys the traffic volume data shown on the right side of Figure 1. The ultimate goal of this study is to automate the measurement of the traffic volume at the cross section and that at the intersection shown in Figure 1. Measurement of the cross-sectional traffic volume requires a vehicle analysis technique, which detects, classifies, and counts vehicles by analyzing video images taken by the video camera (upper left of Figure 1) installed near the survey point. On the other hand, measurement of the traffic volume at the intersection (bottom left of Figure 1) is supposed to require improvements such as applying the analysis technique mentioned above to multiple inflow and outflow points at the intersection. Therefore, it can be said that in order to realize Figure 1, it is necessary to devise a vehicle analysis technique (Figure 2) first, which is the base technique for both. Specifically, the first step is to install a camera at each point to measure the traffic volume. The second step is to place a cross-sectional line in the captured image to count vehicles. The next step is to classify the vehicles as small- or large vehicles by identifying each part of the vehicle.
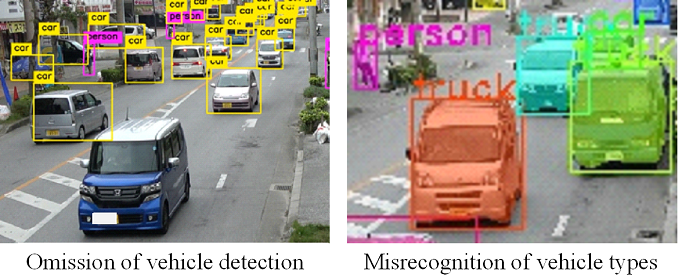
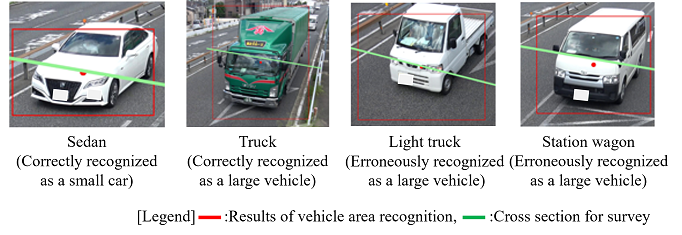
To realize this vehicle analysis technique using camera images, highly accurate detection of vehicles and a technique for vehicle type classification using artificial intelligence are necessary. General AI traffic survey techniques often use Object Detection and Instance Segmentation as methods for recognizing vehicles individually. However, if these techniques are applied simply as they are, it may result not only in detection omission of vehicles but also in misrecognition of a light vehicle as a truck (Figure 3). This is because Object Detection and Instance Segmentation are the methods specialized for object recognition and are not suitable for classifying objects with similar characteristics.
It is also reported that while many techniques enable counting daytime images with high accuracy, they do not reach the counting accuracy required in practice about nighttime images. Since traffic volume surveys are continued for 24 hours in some cases, it is necessary to support nighttime surveys.
In this study, we develop three kinds of techniques(Imai, R., et al. 2022b) including a technique for recognizing vehicles passing through a cross section(Imai, R., et al. 2019), a technique for classifying vehicle types using their parts as identifiers(Nakahata, K., et al. 2022), and a technique for conducting a 24-hour traffic survey(Imai, R., et al. 2022a), then report the results of case studies in which each technique was applied to the video taken during the actual traffic survey. First, regarding the technique for recognizing vehicles passing through a cross section, detection accuracy is improved to avoid the detection omission of vehicles by complementing the results of detecting the previous and following frames of the survey frame. Second, regarding the technique for classifying vehicle types using their parts as identifiers, the accuracy of vehicle type classification is improved by solving the problem of erroneous recognition of the vehicle type with focus on the fact that vehicle types can be classified based on the shape characteristics of each part of the vehicle. Finally, regarding the technique for conducting a 24-hour traffic survey, a technique that can be applied day and night using artificial intelligence is developed to realize a technique to achieve highly accurate traffic volume measurement day and night.
3. Development of a Technique for Recognizing Vehicles Passing through Cross Section
3.1. Overview of the Vehicle Recognition Technique
In this chapter, a vehicle recognition technique using deep learning is developed, and its applicability to traffic volume surveys is verified. Here is a summary of the requirements for implementing a vehicle recognition technique.
– Technique for predicting and interpolating the location at the time of passing the cross section
In a traffic volume survey, the number of vehicles passing through the cross section of the survey is counted. However, from the existing technique mentioned in Chapter 2, it was found that vehicle recognition sometimes fails around the cross section to survey. Therefore, it is necessary to interpolate the location where the vehicle passes through by using the recognition results of previous and following frames. This study uses YOLOv3 (You Only Look Once) (Redmon, J., et al. 2016) to meet this requirement.
– Vehicle tracking technique
When only the recognition results of YOLOv3 are used, no information is maintained to follow the same vehicle from frame to frame, and the vehicle is not tracked. Therefore, it is necessary to track the vehicle using its recognition results. For this requirement, this study uses the nearest neighbor algorithm based on the center of gravity of the recognition results of the previous and following frames to realize tracking, considering them as the same vehicle.
– Technique to accurately determine the vehicle type
It was found that the existing methods tend to make erroneous determination of the type of vehicle, mistaking one for another type with similar color or shape. Therefore, it can be considered that the accuracy of vehicle type determination can be improved by using a method specialized for image classification after acquiring the vehicle region. VGG19(Simonyan, K., et al. 2015) is used for this requirement.
3.2. Experiments to Verify the Accuracy of Application of Vehicle Recognition Technique
In the experiments, a 15-minute video clip of a road with two lanes in each direction in Osaka City is used. Next, vehicle recognition technique is applied to the captured video images to calculate the number of vehicles of each type (small and large vehicles). Finally, the calculated results are compared with the visually counted correct answer values, and evaluated based on the precision ratio, recall ratio, and F-measure.
Table 1 shows the experimental results. Method 1 in Table 1 shows that the F-measure of the number of passing vehicles is 0.935, and that using the proposed interpolation method makes it possible to count vehicles with high accuracy. On the other hand, regarding the number of passing vehicles by type, the F-measure for small cars is 0.830 and that for large cars is 0.562, resulting in a large difference. This is due to the misclassification of station wagons and light trucks as large vehicles, while sedan-type vehicles and trucks are successfully classified, as shown in Figure 4. Therefore, a new classification method for vehicle types is needed. In this study, focusing on the fact that the shape and color of each part of a vehicle is different depending on the vehicle type, we develop a vehicle-type classification technique using the part as an identifier.
Table 1. Accuracy of recognizing vehicles passing through cross section
4. Development of Vehicle-type Classification Technique Using Their Parts as Identifiers
4.1. Overview of Vehicle Type Classification Technique
In this chapter, we focus on the shape and color of each part of the vehicle and develop a method to identify them. This will enable the technique to count the number of passing vehicles by type of vehicle with high accuracy.
In order to define the parts for identification in consideration of the points to focus on in classifying vehicle types, we conducted an interview survey with 10 surveyors with several years to several decades of experience in traffic volume surveys to hear how to classify vehicle types. As a result, it was found that traffic surveyors classify vehicle types by referring to features such as the ratio between the front and sides of the vehicle, the size of the top surface, the number of tires, the ratio of the size of various parts such as the windshield and license plate to the entire vehicle, and the color of the license plate, in addition to the vehicle’s external shape.
Based on the above, this study aims to distinguish eight types of vehicle parts that the surveyers focus on (front, back, left side, right side, top, tires, windshield and license plate) from the background when classifying vehicle types, as shown in Figure 5. By learning these images as identifiers for vehicle type classification together with vehicle images, improvement in the accuracy of vehicle type classification can be expected.
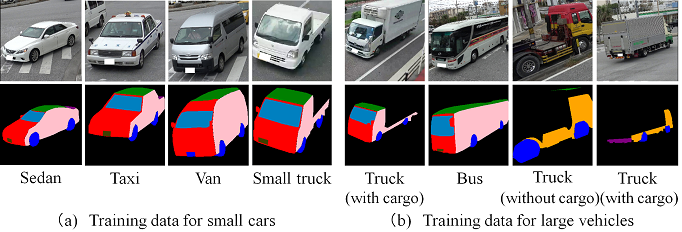
In specific, the first step is to make the area from which the vehicle is cut out into a gray-scale image. The second step is to give different colors manually as attributes to the eight different parts shown in Figure 5. The final step is to generate a model for identifying the parts by learning the images and attributes of the grayscale area by SegNet(Badrinarayanan, V., et al. 2017). When classifying vehicle types, this model is used to generate images of vehicle parts, and then, as in Chapter 3, VGG19 is used to classify vehicle types.
4.2. Experiments to Verify Accuracy of Application of Vehicle Classification Technique
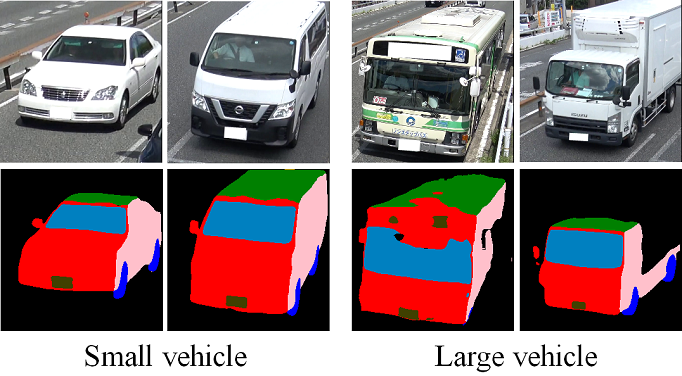
As in Chapter 3, a 15-minute video clip of a road with two lanes in each direction in Osaka City is used in the experiment. Table 1 shows the experimental results. The experimental results indicate that both small and large vehicles can be counted more accurately by Method 2 (proposed in this chapter) than Method 1 (proposed in Chapter 3) in terms of all of the precision ratio, recall ratio, and F-measure. A more detailed check has revealed that small vehicles including sedans, vans, and large vehicles including buses and trucks were correctly classified as shown in Figure 6. This indicates that the proposed method makes it possible to count the number of passing vehicles by vehicle type within a 10% error from the correct answer value, which is the required accuracy in practice. However, when the proposed method was applied to nighttime video images, the accuracy of part identification by SegNet and classification accuracy by VGG19 tended to decrease. This is due to the fact that the entire image is dark, making it difficult to extract vehicle features. Since traffic volume surveys are conducted for 24 hours, it is necessary to support nighttime surveys. Therefore, this study aims to develop a technique that enables counting even at night, and to realize a technique that allows 24-hour measurement of traffic volume.
5. Development of Technique for 24-hour Traffic Volume Survey
5.1. Overview of Technique for 24-hour Traffic Volume Survey
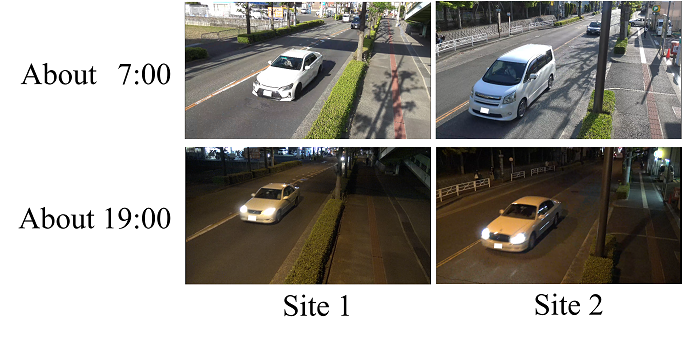
Since a traffic volume survey is conducted for 24 hours in some cases, it is necessary to support nighttime surveys. On the other hand, as shown in Figure 7, images taken at night tend to be less accurate than those taken during the daytime because it is impossible to secure sufficient brightness, making the color and outline of the vehicle unclear. Therefore, this study aims to improve the counting accuracy at night by using artificial intelligence to convert nighttime images into daytime images (hereinafter called night-day conversion) to realize measurement of 24-hour traffic volume. Specifically, the first step is to construct a model for converting brightness of images using CycleGAN(Zhu, J., et al. 2021), which is capable of converting image styles. CycleGAN is a method to transform images by learning the correspondence between two image groups. Daytime and nighttime images are input to CycleGAN and features are extracted for each group of images. Then, CycleGAN learns how nighttime images are transformed into the daytime images and build a model that can transform them into each other. The second step is to convert the brightness of the nighttime video image to a pseudo-daytime video image using the model. This allows easy identification of the features of the image. The final step is to track vehicles and count them by vehicle type, using the proposed method in Chapter 4.
5.2. Experiments on Accuracy of Application of 24-hour Traffic Survey Technique
In the experiments, the proposed method in this chapter was applied to a road with one-lane in each direction in Osaka City (Figure 7), which was different from the road used in Chapters 3 and 4, using video images taken for 24 hours as verification data. The night-day conversion was applied only to the 12-hour nighttime traffic volume from 19:00 to 7:00. In this case, the luminous intensity at night was about 10 lux.
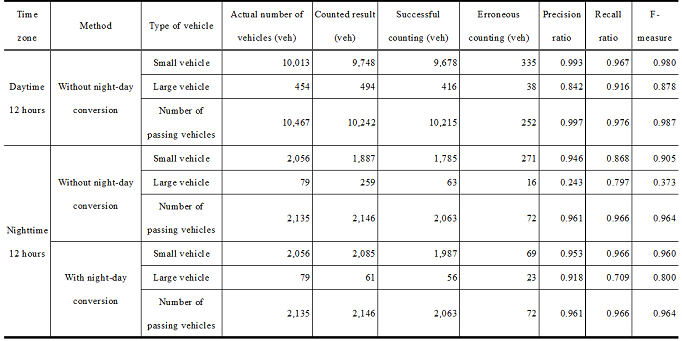
Table 2 shows the experimental results. First, the F-measure for the 12-hour daytime period were 0.980 for small vehicles, 0.878 for large vehicles, and 0.987 for the number of passing vehicles. As shown in Figure 8, it was confirmed that the proposed method enables counting the number of passing vehicles by vehicle type during the daytime period with high accuracy. Second, the F- measure of the 12-hour traffic volume at nighttime without night-day conversion was 0.905 for small vehicles, 0.373 for large vehicles, and 0.964 for the number of passing vehicles. This indicates that although it was possible to count the number of passing vehicles with high accuracy, the classification accuracy for large vehicles significantly decreased. On the other hand, with night-day conversion, the accuracy was 0.960 for small vehicles, 0.800 for large vehicles, and 0.964 for the number of passing vehicles. Compared with the case without night-day conversion, significant improvement in accuracy was confirmed by 0.055 for small vehicles and 0.427 for large vehicles. A detailed check of the images with night-day conversion (Figure 9) shows that both small and large vehicles were in clearly distinguishable shapes. From these points, it was found that the proposed method was capable of measuring 24-hour traffic volume with high accuracy including nighttime.
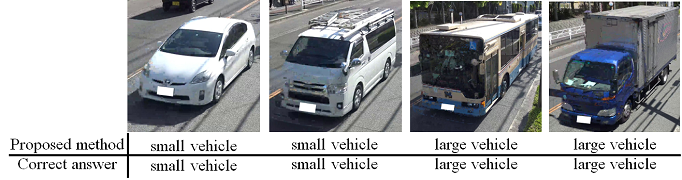
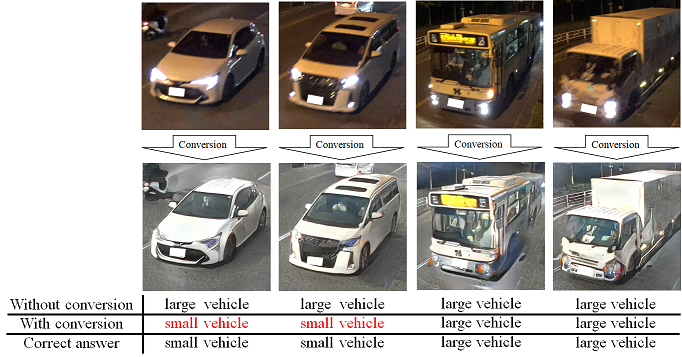
Table 2. Counting accuracy of 24-hour traffic volume
6. Future Development
In this study, we developed three techniques: the technique for recognizing vehicles passing through a cross-section, the technique for classifying vehicle types using their parts as identifiers, and the technique for surveying 24-hour traffic volume. We confirmed the usefulness of each technique from the results of the case study in which respective technologies were applied to the video images taken during the actual traffic volume survey. They are also considered applicable to traffic flow surveys by applying them to the images taken by installing cameras at multiple locations and making measurements.
On the other hand, regarding night-day conversion, it was found that conversion of black vehicles may result in failure, causing a problem of misclassification of vehicle types. In addition, the proposed method was used for small and large vehicles according to the vehicle type classification of the Road Traffic Census. However, this may be further subdivided into smaller vehicle types depending on the purpose of the survey.
For these reasons, in the future, we make effort not only to improve the accuracy of vehicle type classification, but also investigate existing studies to develop these techniques, aiming to expand the usages. This paper was translated and written based on the technical report published by the Image Lab (Imai, R., et al. 2022b).
Author Contributions
Conceptualization, S.T.; methodology, Y.Y., W.J. and M.N.; software, K.N.; validation, K.N.; formal analysis, Y.Y., W.J. and M.N.; investigation, Y.Y., W.J. and M.N.; resources, R.I. and D.K.; data curation, K.N.; writing—original draft preparation, Y.Y., W.J., M.N. and K.N.; writing—review and editing, R.I. and D.K.; visualization, K.N.; supervision, S.T.; project administration, R.I. and D.K.; funding acquisition, R.I. and D.K.
Funding
This research was funded by Survey Research Center Co., Ltd., Chuo Kensetsu Consultant Co., Ltd., Nippon Insiek Co., Ltd. and Intelligent Style Co., Ltd.
Acknowledgments
The proposed techniques in this study have been developed in a joint project with Survey Research Center Co., Ltd., Chuo Kensetsu Consultant Co., Ltd., Nippon Insiek Co., Ltd. and Intelligent Style Co., Ltd.
Conflicts of Interest
The authors declare no conflict of interest.
References
Badrinarayanan, V., Kendall, A. and Cipolla, R.(2017). A Deep Convolutional Encoder-Deconder Architecture for Image Segmentation. Transactions on Pattern Analysis and Machine Intelligence, 39(12), 2481-2495.
Imai, R., Kamiya, D., Yamamoto, Y., Tanaka, S., Nakahara, M. and Nakahata, K.(2019). A Basic Study on Traffic Census using Generic Deep Learning. Journal of Japan Society of Civil Engineers, Ser. F3 Civil Engineering Informatics, 75(2), l_150-l_159.
Imai, R., Kamiya, D., Yamamoto, Y., Tanaka, S., Nakahara, M., Jiang W. and Nakahata, K.(2022a). Research Applying GAN to Nighttime Traffic Census. Journal of Japan Society of Civil Engineers, Ser. F3 Civil Engineering Informatics, 78(2), l_169-l_178.
Imai, R., Kamiya, D., Yamamoto, Y., Nakahara, M., Jiang W., Nakahata, K. and Tanaka, S.(2022b). Measurement of Traffic Census for Automobile using Camera Video and Artificial Intelligence. Image Laboratory, printing.
Nakahata, K., Imai, R., Kamiya, D., Yamamoto, Y., Tanaka, S., Nakahara, M. and Jiang W.(2022). Research for Traffic Census using Segmentation of Automobile Parts. Journal of Japan Society of Civil Engineers, Ser. F3 Civil Engineering Informatics, 75(2), l_158-l_168.
Redmon, J., Divvala, S., Girshick, R. and Farhadi, A.(2016). You Only Look Once: Unified, Real-Time Object Detection. Computer Vision and Pattern Recognition, 29(2), 779-788.
Karen, S. and Andrew, Z.(2015). Very Deep Convolutional Networks for Large-Scale Image Recognition. Int. Conf. on Learning Representations.
Zhu, J., Park, T., Isola, P. and Efros, A. (2021). Unpaired Image-to-Image Translation using Cycle-Consistent Adversarial Networks. https://arxiv.org/pdf/1703.10593.pdf.
Relevant Articles
-

Why do you recall that smelly food? Effects of childhood residence region and potential reinforcing effect of marriage
by Yoshinori Miyamura - 2026,2
VIEW -
An attempt to realize digital transformation in local governments by utilizing the IT skills of information science students
by Edmund Soji Otabe - 2025,4
VIEW -
Wildlife Approach Detection Using a Custom-Built Multimodal IoT Camera System with Environmental Sound Analysis
by Katsunori Oyama - 2025,S2
VIEW -
Research on Indoor Self-Location Estimation Technique Using Similar Image Retrieval Considering Environmental Changes
by - 2025,S3
VIEW