

Search for Articles
Methodological examination of methods for analyzing factors that affect home team advantage: from univariate analysis to multivariate correlation models and causal models
Journal Of Digital Life.2025, 5,1;
Received:October 7, 2024 Revised:October 31, 2024 Accepted:December 10, 2024 Published:February 13, 2025

- Yasufumi Ohyama
- National Institute of Technology (KOSEN), Sasebo College, and Graduate School of Computer Science and System Engineering, Okayama Prefectural University
- Osamu Aoyagi
- Faculty of Health and Sports Science, Fukuoka University
Correspondence: yasufumi@sasebo.ac.jp
Abstract
While most researchers agree that home advantage (HA) exists in soccer, baseball, field hockey, basketball, and other sports regardless of whether they are collegiate or professional, there is no common view on the relationship between “travel,” “familiarity with the game environment,” and “spectator effect” and the factors derived from them and home advantage. However, there is no common view on the relationship between “travel,” “familiarity with the game environment,” “spectator effect,” and their derived factors, and HA. In other words, unless there are new factors that are not addressed here, it is more appropriate to think of the factors that affect HA, which clearly exists, as “multiple factors that relate to each other and affect it comprehensively,” rather than as “factors that affect it independently. Therefore, a possible methodology for examining HA factors is the use of multivariate analysis, such as multiple regression analysis or logistic regression analysis. Then, when illustrating the findings obtained from correlation analysis, one-way arrows are used to show the relationship between the factors, and the focus shifts from the correlation relationship to the search for causal relationships. When the scope of correlation analysis is extended to include causal relationships, path analysis is used to examine not only direct effects but also indirect effects. Furthermore, as a natural development of the methodology of causal analysis, a new direction is considered to be the analysis of covariance structure, which examines the causal relationships between factors, rather than only the observed variables.
keywords:
1. The existence and definition of HA and differences by sport
Many sports use the home-and-away system, in which games alternate between one team’s base (home) and the opposing team’s base (away, and “road” in baseball). The phenomenon of the home team having an advantage in games held at their home ground/stadium is referred to as a HA.
Dowie (1982) confirmed the existence of HA by showing that in soccer World Cups held from 1930 to 1978, many host countries ranked highly. Again, in baseball, Irving and Goldstein (1990) showed the presence of HA by demonstrating that pitchers throw no-hitters or pitch a perfect game more often in home games than away games. It has become standard to categorize games as home and away for game analysis or scouting activities (Courneya and Chelladurai, 1991; Nippon Professional Baseball Organization, 2010, p. 65, p. 119.).
HA is defined as the phenomenon of a team having a winning percentage (WP) of more than 50% when the number of games held home and away is equal (Agnew and Carron, 1994; Courneya and Carron, 1992; Schwartz and Barsky, 1977), and the intensity of HA is determined by the degree to which the WP is more than 50%. HA is said to chiefly occur in football (Lago-Penas, 2012; Poulter, 2009), baseball (Courneya and Chelladurai, 1991), basketball (Cuesta, 2024; Pollard and Gomez, 2007; Sarmento et al., 2014), hockey (McEwan et al., 2012) and cricket (Edward, 1979; Edward and Archambault, 1989). However, there are also reports that HA is seen in tennis, golf, and boxing (Jones, 2013).
Agnew and Carron (1994) reported WPs from 53% to 60% in professional baseball as well as professional and university football and cricket, and from 61% to 70% in professional hockey, professional and university basketball, university baseball and professional soccer. Pollard (1986) stated that soccer has the most significant HA with a WP of 65.2%, followed by basketball with 63.3%, ice hockey with 59.9%, football with 55.0%, and baseball with the lowest WP of 53.6%. Courneya and Carron (1992) reviewed WPs in the published literature for baseball, football, ice hockey, basketball and soccer in order to compute the effect size (ES). They also found that the most noticeable HA was in soccer (average home WP=69.0%, ES=0.38), followed by basketball (64.4%, 0.29), ice hockey (61.1%, 0.22), football (57.3%, 0.15) and baseball with the lowest average home WP (23.5%) and ES (0.07). This has led to the belief that differences in HA exist among sports, with soccer having the strongest HA, followed by basketball and ice hockey, and baseball having the weakest HA (Schwarz and Barsky, 1977).
Although HA affects high school sports to a lesser degree than university and professional sports (McCutcheon, 1984), it is reported that HA is comparatively constant within the same sport, that there is no temporal difference in HA, and that a strong difference in HA cannot be detected between university and professional sports (Courneya and Carron, 1992). In addition, an obvious HA is seen in women’s events (Gayton et al., 1987b).
Since HA is known to exist in sports, it should be positively utilized to win games (Webb, 1984). However, no systematic and comprehensive studies using HA as an academic target have been conducted (Courneya and Carron, 1992; Harada et al., 1996). Consequently, no strong conclusions regarding the effects of HA or how to take advantage of it have been made to date. Therefore, the present study reviewed the literature to determine the factors possibly affecting HA and summarized the related factors, and we propose the new standpoint of using statistical approaches to analyze HA.
2. Key factors influencing HA
Stefani and Clarke (1992) and Harville and Smith (1994) described the following three key factors of HA: the travel factor, the familiarity factor (also called the learning factor), and the audience factor (also called the crowd factor). Whereas these three factors are common to many studies, an additional factor, the rule factor, in which HA is caused by the rules of the game, has also been cited (Agnew and Carron, 1994; Courneya and Carron, 1992). Furthermore, some researchers added the factors of biased judgments by referees and defensive strategies by an away team (Courneya and Carron, 1990). Based on this background information, we will review each of these key factors and the factors indirectly related to them.
3. Travel factor
It is thought that the fatigue stemming from travel time or type of transportation adversely affects an away team in an away game (Courneya and Carron, 1992). Schwarz and Barsky (1977) suggested that HA is associated with the travel factor because the further the distance from the home to an away stadium, the lower the away team’s WP in professional basketball. Snyder and Purdy (1985) claimed that the travel factor impacts HA because when comparing the WPs of home and away teams in university basketball and professional soccer, WPs suddenly dropped from 84.6% to 58.8% if travel distance was further than 200 miles.
The travel conditions for sports teams can widely vary. Pace and Carron (1992) noted that the degree of fatigue is different between cases of moving from home to away games and coming back home from a long road trip. They added that more serious damage, such as irregular sleeping patterns, is caused when crossing the International Date Line from west to east than from east to west due to the time difference.
Moreover, away teams are forced to stay in hotels when touring and have to adjust their daily patterns, lifestyle and eating habits accordingly. In addition to physical fatigue, the divergence from an ordinary lifestyle and the disruption of daily routines caused by travel brings about mental frustration (Courneya and Carron, 1992; Schwarz and Barsky, 1977).
Pace and Carron (1992) analyzed the association between HA and the following factors using multiple regression analysis: travel distance, direction of travel, number of time zones crossed, number of days playing games, number of consecutive days playing games at home, number of consecutive days playing games away, total number of days playing games all season and their interactions. Based on the results, they claimed that since the total variance explained by the independent variables was less than 2%, HA cannot be explained by the travel factor alone. Further, comprehensive studies on baseball and ice hockey did not detect the influence of the travel factor (Courneya and Carron, 1991; Pace and Carron, 1992). To explain this, Agnew and Carron (1994) argued that when comparing travel time by train and airplane, a noticeable difference in HA was not discovered; therefore, HA is not brought about from the fatigue of travel.
Furthermore, Courneya and Carron (1991) found that although it is referred as to travel, returning home from away improves the home team’s condition. They also stated that traveling from home to away does not affect the mental state of an away team when there are 1 or 2 days off before the game; therefore, travel does not necessarily put away teams at a disadvantage. In fact, communication and intimacy among teammates may improve because they spend most of their time together while traveling, and this may in turn improve teamwork (Pace and Carron, 1992).
A problem associated with travel is the accumulation of fatigue. Harada et al. (1996) reported that WP is thought to gradually decline as the season progresses because of accumulating fatigue or mental instability associated with traveling to opposing teams’ home ground/stadium.
From this perspective, Courneya and Carron (1991) and Schwarz and Barsky (1977) compared HA between the first and second halves of a regular season under the assumption that travel fatigue accumulates more easily in the second half of the season than in the first half. However, a significant difference was not found in their results. Similarly, Courneya and Carron (1991) conducted multiple regression analysis predicting HA using the following independent variables: the number of games in a season, the number of games in the championship, the number of days staying at home, the number of days away, and whether a team traveled the day before a game or not. They concluded that the travel factor explains only 2% of HA. Dowie (1982) examined soccer scores by time in World Cups held from 1960 to 1961 and from 1980 to 1981 based to test the hypothesis that, if fatigue affects HA, then goals against away teams increased in the second half of the games that were played. Since no difference was observed between home and away teams, Dowie (1982) concluded that fatigue has little effect on HA.
In this context, it is difficult to conclude that travel fatigue explains HA. It is possible that the fatigue that accompanies travel has been reduced because means of travel and transportation have improved since the early 1990s (Courneya and Chelladurai, 1991; Pace and Carron, 1992). Furthermore, as home and away games alternate, the degree of fatigue should be the same for both home and away teams. Thus, some researchers contended that it is meaningless to investigate the relationship between HA and the travel factor by comparing the first and second halves of a regular season and game (Agnew and Carron, 1994).
4. Familiarity factor
Schwarz and Barsky (1977) stated that familiarity with the facility, stadium or court where the games will be played is a significant advantage. They also considered that, since field specifications are not uniform among baseball stadiums, it is critical for outfielders to be well informed about, for instance, the distance between foul lines and spectator stands, the distance from the home base to outfield fence, and the height and shape of the outfield fence. In addition, they proposed that in football or soccer, a win can be easily be achieved by being accustomed to the condition of the pitch, winds, and the sunlight conditions on the field.
Courneya and Carron (1992) demonstrated that the familiarity factor has the most notable effect on HA by identifying the prominent WP among teams with the largest and smallest fields in their league. Similarly, Dowie (1982) proposed that the size of a field also affects HA in soccer as goals are less likely to be scored on large fields and small fields result in a lower possibility of an offside foul occurring.
Most baseball stadiums are outdoor facilities that are influenced by weather, and are comparatively diverse in size and shape. In contrast, basketball and ice hockey are played indoors and are rarely affected by weather (Schwarz and Barsky, 1977). However, since HA has been found to affect indoor sports more strongly than outdoor sports, it is an apparent contradiction that familiarity with the facility or stadium is closely involved with HA (Agnew and Carron, 1994).
5. Audience Factor
Fukuhara (2007) stated, “Fans can be satisfied by the victory of a home team which they support. At the same time, the existence of fans brings about psychological impact for players. This interaction is thought to give rise to HA.” Likewise, Webb (1984) recognized the cheering of the audience as one of the most significant factors in HA and insisted that it is necessary to systematically and functionally utilize the effect of cheering in order for the team to win because the presence of HA cannot be ignored in university sports. In short, the systematic support of numerous fans is one of the marked reasons for HA. For instance, using the opportunity of the Covid-19 pandemic, McCarrick et al. (2021) documented that in games without fans, home teams created significantly fewer attacking opportunities.
There is another idea that the audience’s enthusiasm and intensity of cheering are not proportional to the absolute number of people in the audience, but rather to the density of spectators. For instance, Schwarz and Barsky (1977) concluded that HA becomes drastic as the density of spectators increases based on the fact that the WP in home games was 48% when the density of spectators was less than 20%, 55% when the density was 20% to 40%, and 57% when the density was more than 40%. Spectator density is considered to be one reason why a marked difference in HA was not observed between the upper and lower leagues in soccer, even though the absolute number of spectators can be ten times higher in the former than the latter. Moreover, Agnew and Carron (1994) examined the association between HA and the number and density of spectators, the time of the season (first or second half), and the position of the opposing team in the league (upper or lower league) using hierarchical multiple regression analysis in junior ice hockey. Consequently, a significant association was detected only in the density of spectators.
However, Courneya and Carron (1992) and Agnew and Carron (1994) insisted that the number of people in the audience and the density of spectators have little connection to HA since the relationship between the WP in home games and the density of spectators in British professional soccer is slight.
In addition to the number of people in the audience and the density of spectators, the stadium and the pace of the game may also be related to the audience factor. For instance, Horn (1988) and Dowie (1982) asserted that because the voices and sounds of spectators echo more effectively in dome-typed stadiums than open-typed outdoor baseball fields, HA often occurs in dome-type stadiums. In addition, Dowie (1982) compared various sports and reported that the many interruptions during baseball games had little effect on HA (home WP of 53%), whereas ice hockey or basketball, which have fewer breaks and interruptions, have a more noticeable HA (home WP of 62%). Based on this, Dowie (1982) pointed out that the quick progress of games without interruption improves HA because the excitement of the audience is maintained.
However, some researchers pointed out that while spectators’ cheering works advantageously on WP, it is also sometimes disadvantageous (Edward, 1979; Edward and Archambault, 1989). Benjafield et al. (1989) demonstrated that contrary to HA, even very strong teams lose home games because of psychological pressure from enthusiastic supporters. Furthermore, sometimes a home team does not show their true ability in excessively important games such as play-offs due to stress created by pressure from the audience. Baumeister and Steinhilber (1984) and Gayton et al. (1987a) stated that a disadvantage, not the advantage that is usually expected, occurs in home games. As the reason, Greer (1983) and Irving and Goldstein (1990) explained that easy motor tasks are promoted by cheering, but accomplishing complicated motor tasks requires concentration and is disturbed by excessive cheering.
Within the allowable range of rules, referees often make judgments that are advantageous to the home team (Courneya and Carron, 1992; Sumner and Mobley, 1981). Some studies have also noted that extremely unusual booing or negative comments from spectators, which not only throws off players but also referees, impacts HA (Greer, 1983; Thirer and Rampey, 1979). Pressure from the audience tends to lead referees to call less fouls on the home team than the away team (Greer, 1983; Pollard, 1986). Similarly, Lehman and Reifman (1987) described that fouls are rarely called on the home team’s star players because the voices, sounds and actions of the spectators indirectly affect referees’ judgments. Therefore, it can be inferred that referees’ judgments are often advantageous for the home team and this is an indirect factor of HA that originates from the audience factor. Actually, by assessing the effect of crowd noise and years of experience on referees’ decisions, Nevill et al. (2002) demonstrated that the noise of the crowd influenced referees’ decisions to favor the home team in football. Furthermore, Bommela et al. (2021) also presented evidence that not only referees but also scorekeepers tend to have greater home team biases when observing men compared to women, higher divisions compared to lower divisions, and stronger teams compared to weaker teams.
Harada et al. (1996) examined the relationship between HA and official game statistics and found that away teams have more fouls than home teams. Similarly, McGuire et al. (1992) found that many fouls originate from aggressive plays by the away team in losing situations. It seems that the higher number of fouls places away teams at a disadvantage compared to home teams. Because a high number of fouls is thought to represent a team’s aggressiveness, an away team can be regarded as more aggressive than a home team (Lefebvre and Passer, 1974). As for the cause of this, it is possible that players on the away team players experience feelings of frustration or anger against the home team due to antagonizing actions and behaviors from the audience (Varca, 1980; Silba and Andrew, 1987). Another reason is that if referees are comparatively lenient towards a home team but very strict towards an away team, players on the away team can easily become frustrated, which can in turn lead to aggression (Lefebvre and Passer, 1974). This latent aggression is considered to influence HA (McGuire et al., 1992). In short, potential aggression within the away team is thought to be closely related to the audience factor and referees’ judgments.
6. Other elements
Takeuchi and Fujino (1988) believed that in baseball, batting in the second part of an inning is more favorable than batting in the first part. In ice hockey too, favorable positioning in line with the rules (e.g. last line change) is thought to influence HA. However, Courneya and Carron (1990) investigated the influence of university softball rules on HA and reported little association, particularly in regard to the home team having an advantage because they can bat last.
Based on the viewpoint that HA depends on sociological factors, Mizruchi (1985) obtained partial correlation coefficients between HA (the ratio of the number of wins in home games to that of away games) and sociological indicators (the area of the community, the age of the stadium, the location of the stadium in the community, the size of the stadium, the density of spectators and number of years the club has been active) while removing the number of wins. The results showed a high correlation existed between the indicators, and HA was obtained when the indicators were a small community (<2000 people) an old stadium (>25 years), a stadium located at the center of the community, a small stadium, a high spectator density, and number of years the club has been active. However, in addition to these audience factors, we did not find any studies that examined HA from a similar sociological standpoint.
Further, Pollard (1986) claimed that an away team’s defensive strategies bring about a psychological advantage for the home team and finally lead to HA. He added that in the case of a play-off game, on the contrary, a home team sometimes suffers from a psychological disadvantage because of the pressure to win from the audience. However, this fact is reasonable when assuming that HA exists. Thus, the away team’s defensive strategies can be thought to indirectly promote HA, but not directly bring about HA.
7. Association among factors
We reviewed the key factors of HA and their related factors as listed in the published literature (Agnew and Carron, 1994; Courneya and Carron, 1990; 1992; Harville and Smith, 1994; Stefani and Clarke 1992). However, some reports that deny a close relationship between HA and the abovementioned factors were also found. This leads us to think that no one factor independently creates HA.
We also investigated the relevant factors originating from the main factors and the relationships between these factors. For example, with regard to the audience and travel factors, it can be deduced that the shorter the distance to travel, the more fans will travel to support their favorite team. Thus, the audience and travel factors are not independent (Courneya and Carron, 1991; Stefani and Clarke, 1992). Moreover, since sound effects are enhanced in dome-typed stadiums, the influence of the audience factor on HA is drastically magnified in vaulted facilities (Horn, 1988). This shows that the familiarity factor and the audience factor are also associated each other.
Similarly, Sumner and Mobley (1981) focused on a specific foul (leg-before-wicket) as one source of HA by citing the example of a cricket game between Australia and England. The Australian team had little experience with the tools (Green English wicket) used on the specific field they played on and the ball bounced unusually well on that particular field. In addition, this condition gave rise to referees’ biased judgment in calling fouls. They concluded that the referees’ biased judgments in calling fouls and the familiarity factor (a specific game condition) are related.
Russell (1983) documented that the association between the density of spectators and aggressiveness is an inverted U-shape, in which aggressiveness is low when the density of spectators is low but aggressiveness increases when the density of spectators increases.
To summarize, as Schwarz and Barsky (1977) and Pollard (1986) pointed out, the factors of HA have a complicated mechanism and do not independently influence HA, but rather impact it in a comprehensive way by interacting with each other. Moreover, Edward (1979), Edward and Archambault (1989), and Courneya and Carron (1991) insisted that the inconsistent outcomes across studies can be explained by the theory that no single factor is involved in HA, but that several factors impact HA in an intricate fashion. Therefore, using higher-dimensional confounding factors as well as main factors is an appropriate statistical framework method for analyzing HA (Pollard, 1986; Varca, 1980).
8. Correlational methods for HA analysis
Although HA is an observable phenomenon, no single factor has been found to have a significant effect on HA independently. From this fact, it can be deduced that two or more factors interact with each other to comprehensively influence HA. In order to investigate the relationship between HA and its factors, some types of linear models (regression models predicting a dependent variable with two or more independent variables connected by summation) that consider mutual relationships can be used.
Pace and Carron (1992) used multiple regression analysis to examine the association between HA and the factors they suspected to be related to HA (travel distance, direction of travel, number of time zones crossed, number of days playing games, number of consecutive days playing games at home, number of consecutive days playing games away, total number of days playing games all season and their interactions. Harada et al. (1996) analyzed the relationship between HA and correlative factors (number of spectators, density of spectators and number of days in game sessions) using logistic regression analysis with a dependent variable coding wins and losses in home games into binary data. In these analyses, the degree of influence of individual factors can be obtained as (standardized) regression coefficients while removing the influence of the other factors.
Additionally, Agnew and Carron (1994) applied hierarchical regression analysis to junior ice hockey in order to investigate the relationship between HA and relevant factors (number of people in the audience, density of spectators, time of the regular season (first or second half), and level of the opposing team’s league (major or minor)). In hierarchical regression analysis, regression equations including interaction terms as well as main effects are repeatedly obtained.
9. Modeling the causal relationship of HA
Carron et al. (2005) reviewed Courneya and Carron (1992) and modeled the content of that review. In that model, the difference between home and away venues is first affected by the factors of game Location. In other words, there are crowd factors, such as the size, density, and closeness of the crowd; learning factors, including familiarity with the venue; travel factors, for instance, fatigue caused by the away team’s travel; and factors related to the rules. This game location factor affects the players (competitors, coaches, referees), causing physiological changes, such as the secretion of hormones, including testosterone and cortisol, and psychological changes, like motivation, anxiety, and confidence. Furthermore, these physiological and psychological conditions cause aggression, effort, perseverance in competitors, style of play, tactics and strategic decisions in coaches, and subjective decisions in referees. These ultimately affect performance outcomes, with primary factors affecting fundamental skills and secondary factors affecting goals or points scored, and ultimately affecting win/loss outcome measures. In this conceptual model, each factor is connected by a one-way arrow, and it can be said that it is a one-dimensional conceptual causal model because it shows causality rather than just meaning correlation.
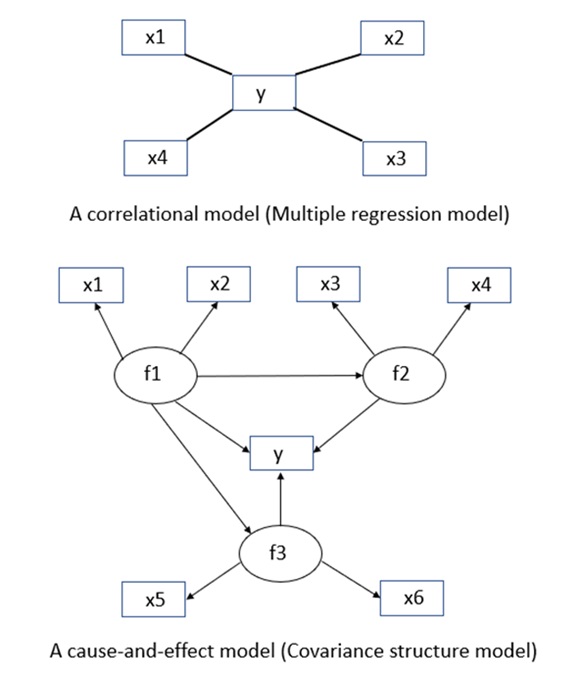
In addition, Bilalic et al. (2024) illustrated a model in which the seven factors assumed by Pollard and Pollard (2005)—namely crowd (support), travel (fatigue), familiarity (with local conditions), territoriality, tactics, psychological factors, and referee bias—interact with each other to affect HA. In this model, the arrows show the influence of the seven factors on HA and the influence of each factor on the others. In other words, as with Carron et al. (2005), it does not simply show the correlation between factors but also shows the causal relationship between them. However, the causal relationship between factors is not in a linear manner and differs in that all factors directly affect HA, and the relationship between factors is limited to a few combinations. Figure 1 shows a schematic comparison of correlation and causal models.
Bilalic (2024) also developed his own HAM model and tested its validity. The HAM model assumes that the physiological factors of venue, crowd, familiarity, and fatigue each secrete the hormones testosterone, cortisol, and adrenaline, which in turn affect the coach’s tactics and style of play, subsequently affecting the players, and consequently impacting the referee’s performance, and which ultimately affects the outcome of the match (win/loss, points, scores). Furthermore, he proposes a mediation model in which the factors are consolidated into venue, referee bias, and team performance, and the influence on the match result (outcome) is not only the direct influence from the venue, but also the influence via referee bias and team performance, and he proposes a model with various paths of influence and which verifies the influence.
10. Methodology for HA causal relationship models
A model in which various factors are related to each other and affect HA leads to the introduction of multivariate analysis methods. If the purpose of the study is only to investigate the size of the relationship, it is possible to solve it using the correlational model mentioned above, but if the relationship between the factors is expressed using a one-way arrow and the causal relationship between cause and effect is referred to, causal analysis is required.
Strictly speaking, while statistical methods can reveal correlations, they are considered to be separate from causal relationships. In other words, even if a high correlation is seen between two aspects, statistical methods do not reveal whether one of them is the cause and the other is the result. However, in statistical causal analysis, if 1) there is a high correlation between the two (covariation); 2) one precedes the other either temporally or logically (sequence); and 3) a high correlation is observed even when the influence of a third variable is removed (nonspurious covariation), then causality is assumed (Hair et al., 2010). The validity of the model is then verified based on how well the data aligns with the hypothetical model assumed by each person.
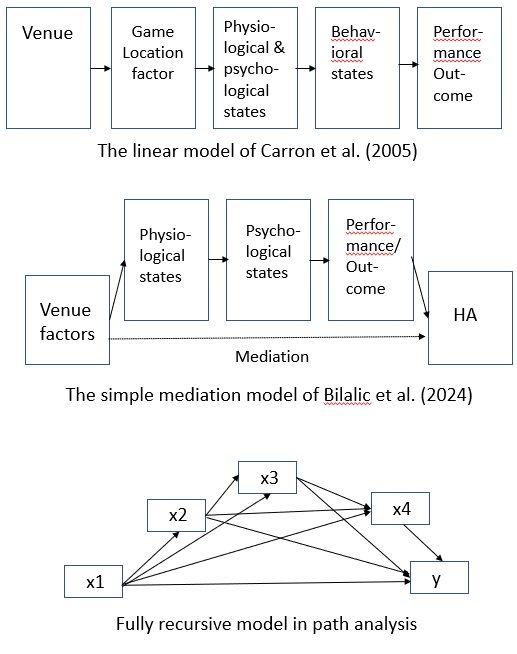
Path analysis is used to specifically obtain the linear model of Carron et al. (2005) and the HAM model of Bilalic (2024) from the data, and the effect expressed by a one-way arrow is called a “direct effect,” and the standard partial regression coefficient of the multiple regression equation is obtained by setting the variable that the arrow pierces as the dependent variable and the variable from which the arrow comes as the independent variable. In addition, the effect of an intermediary variable is referred to as an “indirect effect” and is calculated as the product of the standard partial regression coefficients corresponding to the path. The validity of the model is determined by the multiple correlation coefficient for each regression equation. In particular, a model in which the preceding variable has an effect on all subsequent variables is called a “fully recursive model” (Naoi, 1992). In the case of a full recursive model, the explanatory power of a newly added variable is explained by the increment of the newly added model’s determination coefficient (the square of the multiple correlation coefficient) from that explained by the previous variables. For example, the model of Courneya and Carron (1992) corresponds to the full sequential model of path analysis (Naoi, 1992). Figure 2 shows a schematic comparison of the linear model of Carron et al. (2005), the model with mediation of Bilalic (2024), and the fully sequential model.
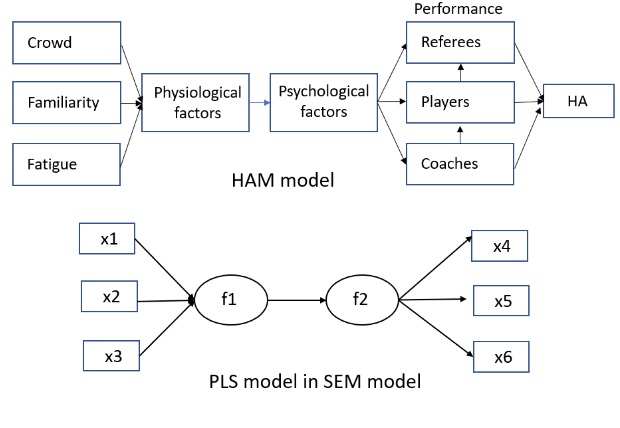
The development of the methodology of “causal analysis using path analysis” naturally leads to covariance structure analysis, which concerns the causal relationship between factors as common fluctuations in multiple observed variables, based on the relationship between single observed variables. The factors in the model described above were based on a single variable for each phenomenon. For example, the travel effect was represented by the distance traveled. However, if we consider it in relation to fatigue, it is better to make a more multifaceted assessment by taking into account the means of transport (car, bus, train, or plane), travel time, whether or not there are transfers, and the direction of travel (east to west or west to east), etc., and it is easier to generalize the model obtained. For this reason, it is recommended that a methodology for examining the causal relationships of HA be based on a covariance structure analysis (structural equation model, Dillon and Goldstein, 1984) that assumes common factors in several surveyed items and draws arrows between those factors to express causal relationships. For example, Bilalic et al. (2024) used a PLS (partial least square (Wakui and Wakui, 2003) model for their covariance structure analysis, so we can use a covariance structure analysis as a methodology for actually verifying this model. Figure 3 shows a schematic comparison of the HAM model of Bilalic et al. (2024) and the PLS model of covariance structure analysis.
However, path analysis and covariance structure analysis do not propose a model based on the analysis once the data has been obtained. Rather, the researcher sets up their own model based on their hypothesis and then verifies its validity based on the degree of fit. For this reason, it is possible to create various models based on different hypotheses. For example, in their model, Pollard and Pollard (2005) propose a model consisting of crowd (support), travel (fatigue), familiarity (with local conditions), territoriality, tactics, psychological factors, and referee bias, while Bilalic et al. (2024) propose a model consisting of venue, physiological factors, psychological factors, performance of coaches, players, and referees, and the variables and factors that make up the model are left to the researcher’s hypothesis. In that sense, if the hypothetical model includes the mutual relationships (arrows), countless patterns can be considered. In this way, while there is a degree of freedom, in order to organically summarize the research results, it is necessary to accumulate a large number of research results (Yoshida et al., 2020).
11. Conclusion
Many researchers have recognized that HA exists in soccer, baseball, hockey, basketball and other sports at both the university and professional level. However, there is no common view on the relationship between HA and the three key factors of travel, familiarity and audience and the associated factors that originate from these key factors. In short, unless there are other factors that have yet to be discovered, HA must be explained by the previously mentioned factors. It is reasonable that these factors do not affect HA independently, but rather two or more factors interact with each other to comprehensively influence HA. Therefore, multivariate analysis such as multiple regression analysis or logistic regression analysis, which considers mutual relationships of independent variables, is recommended to analyze HA. A statistical approach that investigates the relationship between or contribution of two or more relevant factors while keeping the impact of other factors constant is required to determine the comprehensive relationship of HA.
Additionally, when illustrating the findings obtained from correlation analysis, one-way arrows are used to show the relationship between the factors, and the focus shifts from the correlation relationship to the search for causal relationships. When the scope of correlation analysis is extended to include causal relationships, path analysis is used to examine not only direct effects but also indirect effects. Furthermore, as a natural development of the methodology of causal analysis, a new direction is considered to be the analysis of covariance structure, which examines the causal relationships between factors, rather than only the observed variables.
12. Limitations of this study
This study reviewed the factors that affect HA in two or more sports and also examined the methodology for examining their effects. When comparing factors, it is important to comprehensively compare the degree of association of all factors in all sports, and this should be done. However, due to the characteristics of the sports, there are cases where the factors that may affect HA are not available. For instance, professional baseball is only for men and not for women, so studies that examine gender differences cannot be referenced. Professional baseball can be compared between outdoor, dome, and indoor, but ice hockey is only played indoors, and field hockey is limited to outdoor play. That is to say, the factors that affect HA are “nested” within the sport, not “crossed,” so a comprehensive comparison and examination is not possible. The results of this study are based on the limitations of such research conditions.
Author Contributions
Conceptualization, Y.O. and O.A.; methodology, Y.O. and O.A.; validation, Y.O. and O.A.; writing—original draft preparation, Y.O. and O.A.; writing—review and editing, Y.O. and O.A.; supervision, Y.O. and O.A.; project administration, O.A.; funding acquisition, Y.O. and O.A.; All authors have read and agreed to the published version of the manuscript.
Funding
This research was supported by grants-in-aid for scientific research from the JSPS Numbers 20K11381.
References
Agnew, G. A. and Carron, A. V. (1994). Crowd effects and the home advantage. International Journal of Sport Psychology, 25: 53-62.
Baumeister, R. F. and Steinhilber, A. (1984). Paradoxical effects of supportive audiences on performance under pressure: The home field disadvantage in sports championships. Journal of Personality and Social Psychology, 47:85-93. https://doi.org/10.1037/0022-3514.47.1.85
Benjafield, J., Liddell, W. W. and Benjafield, I. (1989). Is there a home field disadvantage in professional sports championships? Journal of Social Behavior and Personality, 17: 445-50. https://doi.org/10.2224/sbp.1989.17.1.45
Bilalic, M., Gula, B., Vaci, N. (2024). Revising home advantage in sport – home advantage mediation (HAM) model. International Review of Sport and Exercise Psychology, 17(1):1-27. https://doi.org/10.1080/1750984X.2024.2358491
van Bommela,M., Bornna, L., Chow-Whiteb, P., Gaoc, C. (2021). Home sweet home: Quantifying home court advantages for NCAA basketball statistics. Journal of Sports Analytics, 7: 25–36.
Carlos, L. (2012) The Role of Situational Variables in Analysing Physical Performance in Soccer. Journal of Human Kinetics, 35: 89-95.
Carron, A. V., Loughhead, T. M., Bray, S. R. (2005). The home advantage in sport competitions: Courneya and Carron’s (1992) conceptual framework a decade later. Journal of Sports Sciences, 23(4): 395-407.
Courneya, K. S. and Carron, A. V. (1990). Batting first versus last: Implications for the home advantage. Journal of Sport and Exercise Psychology, 12: 312-316. https://doi.org/10.1123/jsep.12.3.312
Courneya, K. S. and Carron, A. V. (1991). Effects of travel and length of home stand/road trip on the home advantage. Journal of Sport and Exercise Psychology. 13: 42-49. https://doi.org/10.1123/jsep.13.1.42
Courneya, K. S. and Carron, A. V. (1992). The home advantage in sport competitions: A literature review. Journal of sport and exercise psychology, 14: 13-27. https://doi.org/10.1123/jsep.14.1.13
Courneya, K. S. and Chelladurai, P. (1991). A model of performance measures in baseball. Journal of Sport and Exercise Psychology. 13: 16-25. https://doi.org/10.1123/jsep.13.1.16
Cuesta, I. M., Jimenez-Saiz, S. L., Kelly, A. L., Bustamante-Sánchez, A.(2024). The Influence of Home-Court Advantage in Elite Basketball: A Systematic Review. Journal of Functional Morphology and Kinesiology, 9:1-19. https://doi.org/10.3390/jfmk9040192
Dillon, W. R., Goldstein, M. (1984). Multivariate analysis: Methods and applications. John Wiley & Sons: New York, pp. 437-453.
Dowie, J. (1982). Why Spain should win the World Cup. New Scientist, 10: 693-695.
Edwards, J. (1979). The home advantage. In Goldstein, J. H. (Ed.), Sports, games, and play: Social and Psychological Viewpoints. Erlbaum: Hillsdale. pp. 409-430.
Edwards, J. and Archambault, D. (1989). The home advantage. In Goldstein, J. H. (Ed.), Sports, games, and play: Social and Psychological Viewpoints. Erlbaum: Hillsdale. pp. 333-370.
Fukuhara, T. (2007). Investigation of home advantage in professional sports leagues. Aoyama Journal of Social Sciences Economics, Law and Business 35(2): 1-28.
Gayton, W. F., Matthews, G. R. and Nickless, C. J. (1987). The home field disadvantage in sports championships: Does it exist in hockey? Journal of Sport Psychology, 9:183-185. https://doi.org/10.1123/jsp.9.2.183
Gayton, W. F., Mutrie, S. A. and Hearns, J. F. (1987). Home advantage: Does it exist in women’s sports. Perceptual and Motor Skills, 65: 653-654. https://doi.org/10.2466/pms.1987.65.2.653
Greer, D. L. (1983). Spectator booing and the home advantage: A study of social influence in the basketball arena. Social Psychology Quarterly, 46: 252-261. https://doi.org/10.2307/3033796
Hair, J. F. Jr., Black, W. C., Babin, B. J., Anderson, R. E. (2010). Multivariate data analysis: A global perspective, 7th Ed., Pearson: Upper Saddle River, pp. 644 – 645.
Harada, N., Morino, S., Harada, M. and Kikuchi, H. (1996). Research on home advantage and crowd factors. Research Journal of Health and Sport Science, Chukyo University 38(1): 59-66.
Harville, D. A. and Smith, M. H. (1994). The home-court advantage: How large is it, and does it vary from team to team? The American Statistician, 48(1): 22-28.
Horn, J. C. (1988). Dome-inating the game. Psychology Today, 10: 20.
Irving, P. G. and Goldstein, S. R. (1990). Effect of home-field advantage on peak performance of baseball pitchers. Journal of Sport Behavior, 13: 23-28.
Jones, M. B.(2013). The home advantage in individual sports: An augmented review. Psychology of Sport and Exercise, 14: 397-404. https://doi.org/10.1016/j.psychsport.2013.01.002
Lago-Penas, C.(2012). The Role of Situational Variables in analyzing physical performance in soccer. Journal of Human Kinetics, 35: 89-95.
Lefebrve, L. M. and Passer, M. W. (1974). The effects of game location and importance on aggression in team sport. International Journal of Sport Psychology, 5: 102-110.
Lehman, D. R. and Reifman, A. (1987). Spectator influence on basketball officiating. Journal of Social Psychology, 127: 673-675.
McCarrick, D., Bilalic, M., Neave, N. Wolfson, S. (2021). Home advantage during the COVID-19 pandemic: Analyses of European football leagues. Psychology of Sport and Exercise, 56: 1-10. https://doi.org/10.1016/j.psychsport.2021.102013
McCutcheon, L. E. (1984). The home advantage in high school athletics. Journal of Sport Behavior, 7: 135-138.
McEwan, D., Ginis, K. A. M., Bray, S. R. (2012). “With the Game on His Stick”: The home (dis)advantage in National Hockey League shootouts. Psychology of Sport and Exercise, 13: 578-581. https://doi.org/10.1016/j.psychsport.2012.03.007
McGuire, E. J., Courneya, K. S., Widmeyer, W. N. and Carron, A. V. (1992) Aggression as a potential mediator of the home advantage in professional ice hockey, Journal of Sport and Exercise Psychology, 14: 148-158. https://doi.org/10.1123/jsep.14.2.148
Mizruchi, M. S. (1985). Local sports teams and celebration of community: A comparative analysis of the home advantage. Sociological Quarterly, 26: 507-518. https://doi.org/10.1111/j.1533-8525.1985.tb00241.x
Naoi, Y. (1992). Fundamentals of Social Research, Saiensu-sha: Tokyo, pp. 162-204.
Nevill, A.M., Balmer, N.J., Williams, A. M. (2002). The influence of crowd noise and experience upon refereeing decisions in football. Psychology of Sport and Exercise, 3: 261–272. https://doi.org/10.1016/S1469-0292(01)00033-4
Nihon Baseball League Organization (2010). Official baseball guide 2010. Kyodo-tsushin-sha: Tokkyo, p.65 and p.119.
Pace, A. and Carron, A. (1992). Travel and the Home Advantage. Canadian Journal of Sport Science. 17: 60-64.
Pollard, R. (1986) Home advantage in soccer: A retrospective analysis. Journal of Sports Sciences, 4: 237-248. https://doi.org/10.1080/02640418608732122
Pollard, R., Gomez, M. A. (2007). Home advantage analysis in different basketball leagues according to team ability. Iberian Congress on Basketball Research, 4: 61-64.
Pollard, R., Pollard, G. (2005). Long-term trends in home advantage in professional team sports in North America and England (1876–2003). Journal of Sports Sciences, 23(4): 337–350. https://doi.org/10.1080/02640410400021559
Poulter, D. R. (2009). Home advantage and player nationality in international club football. Journal of Sports Sciences, 27(8): 797-805. https://doi.org/10.1080/02640410902893364
Russell, G. W. (1983). Crowd size and density in relation to athletic aggression and performance. Journal of Social Behavior and Personality. 11: 9-15. https://doi.org/10.2224/sbp.1983.11.1.9
Sarmento, H., Marcelino, R. M., Anguera, T., Campanio, J. N., LeitAo, J. C.(2014). Match analysis in football: A systematic review, Journal of Sports Sciences, 32(20): 1831-1843. https://doi.org/10.1080/02640414.2014.898852
Schwartz, B. and Barsky, S. F. (1977). The home advantage. Social Forces, 55: 641-661. https://doi.org/10.1093/sf/55.3.641
Silva, J. M. and Andrew, J. A. (1987). An analysis of game location and basketball performance in the Atlantic Coast Conference. International Journal of Sport Psychology, 18: 188-204.
Snyder, E. E. and Purdy, D. A. (1985). The home advantage in collegiate basketball. Sociology of Sport Journal, 2: 352-356. https://doi.org/10.1123/ssj.2.4.352
Stefani, R. and Clarke, S. (1992). Predictions and home advantage for Australian rules football. Journal of Applied Statistics, 19(2): 251-261. https://doi.org/10.1080/02664769200000021
Sumner, J. and Mobley, M. (1981). Are cricket umpires biased? New Scientist, 2: 29-31.
Takeuchi, K. and Fujino, Y. (1988). Mathematical science of sports: how to analyze sports data to enjoy sports more, Kyoritsu-shuppan: Tokyo, pp.137-159.
Thirer, J. and Rampey, M. (1979). Effects of abusive spectator behavior on the performance of home and visiting intercollegiate basketball teams. Perceptual and Motor Skills, 48: 1047-1053. https://doi.org/10.2466/pms.1979.48.3c.1047
Varca, P. (1980). An analysis of home and away game performance of male college basketball teams. Journal of Sport Psychology, 2: 245-257. https://doi.org/10.1123/jsp.2.3.245
Wakui, Y. and Wakui, S. (2003) Understanding Covariance Structure Analysis with Diagrams. Nihon-Jitsugyo-Shuppan: Tokyo, pp.135-139.
Webb, G. (1984). Maximizing your home field advantage. Interscholastic Athletic Administration, 23: 20-23.
Yoshida, T., Murai, J., Usami, S., Shojima, K., Oshio, A., Suzuki, M., Shiina, K. (2020) What Has Structural Equation Modeling Brought to Psychology? The Annual Report of Educational Psychology in Japan, 59: 292-303.
Relevant Articles
-

Why do you recall that smelly food? Effects of childhood residence region and potential reinforcing effect of marriage
by Yoshinori Miyamura - 2026,2
VIEW -
Exploring Undergraduate Students’ Transformative Learning Experiences through an eHealth Literacy Workshop in Japan
by Takafumi Tomura - 2026,1
VIEW -
An attempt to realize digital transformation in local governments by utilizing the IT skills of information science students
by Edmund Soji Otabe - 2025,4
VIEW -
A practical evaluation method using item response theory to evaluate children’s form of Jumping-over and crawling-under
by Yasufumi Ohyama - 2025,3
VIEW