

Search for Articles
Special Issue Engineering in General Information Sciences Others
A Study on the Development of a Traffic Volume Counting Method by Vehicle Type and Direction Using Deep Learning
Journal Of Digital Life.2025, 5,S4;
Received:November 21, 2024 Revised:January 29, 2025 Accepted:February 27, 2025 Published:March 26, 2025

- Yuhei Yamamoto
- Faculty of Environmental and Urban Engineering, Kansai University
- Masaya Nakahara
- Faculty of Information Science and Arts, Osaka Electro-Communication University
- Ryo Sumiyoshi
- Doctoral Course Graduate School of Engineering and Design, Hosei University
- Wenyuan Jiang
- Faculty of Engineering, Osaka Sangyo University
- Daisuke Kamiya
- Faculty of Engineering, University of the Ryukyus
- Ryuichi Imai
- Faculty of Engineering and Design, Hosei University
Correspondence: imai@hosei.ac.jp
Abstract
The turning movement count is investigated to understand the traffic conditions at intersections and identify bottleneck locations. In recent years, methods utilizing probe data and AI-based analysis of video images have been developed to streamline the survey process. Existing methods can count vehicles as they pass but struggle to classify vehicle types. Therefore, the objective of this study is to develop a method for counting turning movement count by vehicle type using deep learning. In this method, YOLOv8 is used to detect cars, buses, and trucks in video images, and BoT-SORT is used for tracking. When a vehicle being tracked crosses the cross-sectional lines and auxiliary lines at the intersection captured in the video images, it is counted by class. In this case, the entry direction of vehicles that cannot be determined upon entering the intersection is estimated based on accurately counted vehicles. Additionally, the entry direction is inferred from a series of vector information within the detection bounding boxes. The results of the verification experiment showed that the proposed method can count the directional traffic volume with an accuracy of over 95.0% and classify the three vehicle classes—car, bus, and truck—with an accuracy of over 90.0%.
1. Introduction
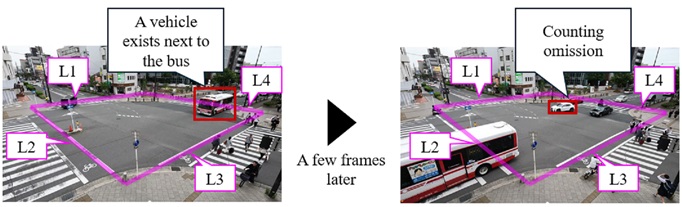
In many countries, turning movement counts surveys are conducted to understand the usage of roads (Japan International Cooperation Agency, 2018 and Streetlight Data, 2024). In Japan, turning movement counts are counted by turning movements (right-turn, left-turn, and straight) and vehicle type to understand traffic conditions at intersections and identify bottleneck locations. This survey requires at least four surveyors per intersection, leading to increased survey costs as the number of survey locations increases. For example, in Tokyo, a large-scale survey was conducted as part of the Major Intersection Traffic Volume Survey, covering 125 intersections and requiring more than 500 surveyors (Metropolitan Police Department, 2023). Against this backdrop, in recent years, the Ministry of Land, Infrastructure, Transport and Tourism has been exploring survey methods that utilize probe data to streamline the process, as well as methods that analyze recorded video images using AI (Ministry of Land, Infrastructure, Transport and Tourism, 2019). A survey method using probe data has demonstrated the potential to count turning movement counts by combining ETC 2.0 probe data with data collected from vehicle detectors (Shiomi, 2022). However, when the penetration rate of vehicles equipped with ETC 2.0 probe data is low, the accuracy of traffic volume counting decreases, presenting a significant challenge. Although the penetration rate is expected to increase as more vehicles are equipped with ETC 2.0 onboard units, the installation incurs additional costs. Therefore, it is challenging to rapidly promote the widespread adoption of onboard units. In response, we focused on a survey method that analyzes video images using AI. As survey methods using AI, there are two primary approaches: one involves counting based on vehicle trajectories (Horii et al., 2022), and the other sets cross-sectional lines on roads visible in video images and counts vehicles passing through these lines (Watanabe et al., 2023). However, the former method faces a challenge in that vehicle trajectories differ for each intersection, requiring parameter adjustments for counting every time the target intersection changes. This challenge could potentially be resolved by predefining the camera angles during filming, which may reduce variations in vehicle trajectories specific to each intersection. However, this approach cannot be applied to intersections that do not fit the predefined camera angles, leading to a reduction in versatility. The latter issue, as shown in Fig.1, arises from the occlusion that occurs when vehicles overlap near the cross-sectional line, causing vehicles farther from the camera to be obscured, which leads to counting omissions. To address this issue, we have developed a method for counting turning movement counts that sets auxiliary lines in addition to cross-sectional lines as a countermeasure against occlusion (Sumiyoshi et al., 2024). However, this method cannot count turning movement counts categorized by vehicle type. Therefore, the purpose of this study was to develop a method for counting turning movement counts by vehicle type using deep learning applied to video images of intersections. In Section 2, the proposed method is explained in detail, and the experimental conditions for verifying its effectiveness are described. Section 3 evaluates and discusses the results of the demonstration experiments. Section 4 provides a summary of this study.
2. Methods
In this section, we summarize the challenges identified in existing research and outline the development strategy of the method devised in this study. Next, we provide a detailed explanation of the proposed method. Then, we describe the conditions of the empirical experiments conducted using this method.
2.1 Development Approach for Counting Turning Movement Counts by Vehicle Type
This section organizes the challenges identified in existing studies and outlines the development approach for the method proposed in this study (Watanabe et al., 2023). This method has been reported to result in counting omissions when occlusion occurs within the region enclosed by the cross-sectional line, causing the vehicle ID to switch (see Fig.1). Hamamura et al. utilized YOLOv7, an object detection method, fine-tuning it with images of passenger cars, light trucks, buses, and motorcycles to count cross-sectional traffic volumes by vehicle type (Hamamura et al., 2023). Additionally, Okubo et al. employed the SSD object detection method, training it with images of light trucks, buses, passenger cars, small trucks, pedestrians, motorcycles, and bicycles to count cross-sectional traffic volumes by the trained classes (Okubo et al., 2020). These methods aim to count cross-sectional traffic volumes, leading to the placement of cross-sectional lines closer to the camera. However, to count turning movement counts, it is necessary to place cross-sectional lines at positions farther from the camera. Therefore, near the cross-sectional lines farther from the camera, vehicles appear smaller in the footage, potentially leading to a decrease in vehicle classification accuracy.
Based on the above, this study proposes a method to address undercounting caused by occlusion. The method involves analyzing traffic conditions using vehicles that are correctly counted and estimating the inflow directions of vehicles for which only outflow directions can be determined. Additionally, to improve the classification accuracy of small vehicles appearing in the footage, this study employs the YOLOv8x model, which can detect smaller objects with higher precision than YOLOv7 by replacing the Detection Head with one based on NAS-FPN (Varghese, R and Sambath, M, 2024). Furthermore, to enhance vehicle classification accuracy, this study incorporates not only the classification results of vehicles on the cross-sectional line but also employs a majority voting approach based on the classification results of vehicles within the area enclosed by the cross-sectional lines.
2.2 Proposal of a Method for Counting Turning Movement Counts by Vehicle Type
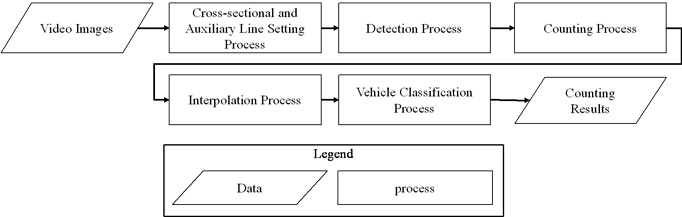
The processing flow of the proposed method is illustrated in Fig.2. This process consists of cross-sectional and auxiliary line setting, detection, counting, interpolation, and vehicle classification.
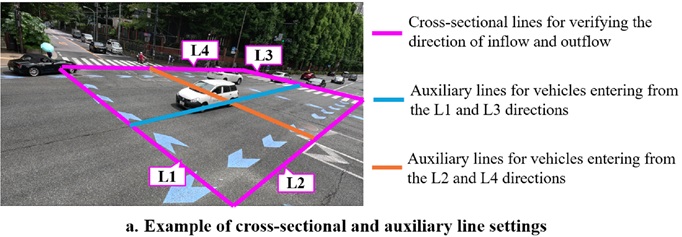
In the cross-sectional and auxiliary line setting process, cross-sectional and auxiliary lines are established to determine the inflow and outflow directions. The flow of the process is illustrated in Fig.3a. First, eight points (points 1 through 8) are manually selected to enclose the intersection. Next, lines are drawn connecting points 1 and 2, points 3 and 4, points 5 and 6, and points 7 and 8. These lines are extended until adjacent lines intersect. Then, auxiliary lines are established by connecting the midpoints of opposing cross-sectional lines. This approach reduces the impact of occlusion within the area enclosed by the cross-sectional lines.
In the detection process, vehicles appearing in the video images are detected and tracked to count turning movement counts. In this process, the YOLOv8x model is used to detect three classes: car, bus, and truck. Next, the detected vehicles are tracked using BoT-SORT (Aharon et al., 2022). During this process, an ID is assigned to each tracked vehicle to prevent excessive counting at the cross-sectional lines.
In the counting process, vehicles crossing the cross-sectional and auxiliary lines are counted. First, when the midpoint of the bottom edge of a bounding box for a detected vehicle passes over a cross-sectional or auxiliary line, the ID of that vehicle is recorded. This allows for determining the direction from which the vehicle entered. Subsequently, when the midpoint of the bottom edge of the bounding box for the detected vehicle crosses another cross-sectional line, the vehicle’s ID is recorded again. This process determines the outflow direction and ensures the vehicle is counted as a single unit.
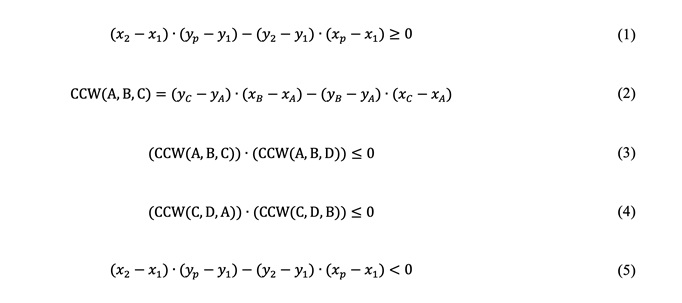
Here, an example is explained for the case where a vehicle enters from L1 direction and exits from L3 direction. In determining the entry direction, it is assessed whether the vehicle has passed the cross-sectional lines and auxiliary lines by verifying if it satisfies equation (1). In this case, x1, y1 represents the intersection of L1 and L4, x2, y2 represents the intersection of L1 and L2, and xp, yp represents the midpoint of the lower edge of the bounding box in the previous frame. Next, the intersection between the line segment connecting the midpoints of the lower edges of the rectangle and L1 is determined using equations (2), (3), and (4). The CCW (Counter Clockwise) function defined in (2) is used to evaluate the geometric configuration of three points. When the result of this function is positive, the points are arranged in a counterclockwise order; when negative, they are arranged in a clockwise order; and when zero, the points are collinear. Furthermore, when both equations (3) and (4) are satisfied, it can be determined that the two line segments intersect, indicating that there is an enters from the direction of L1. In this case, A represents the midpoint of the lower edge of the bounding box in the previous frame, B represents the midpoint of the lower edge of the bounding box in the current frame, C represents the intersection of L1 and L4, and D represents the intersection of L1 and L2. In determining the exit direction, equation (5) is used to assess whether the midpoint of the lower edge of the bounding box in the previous frame is located within the region enclosed by the cross-sectional lines. In this case, x1, y1 represent the intersection of L3 and L4, x2, y2 represent the intersection of L3 and L2, and xp, yp denote the midpoint of the lower edge of the bounding box in the previous frame. Furthermore, similar to the entry direction determination, equations (2), (3), and (4) are used to verify whether the line segment connecting the midpoints of the lower edges of the bounding boxes intersects with L3. If an intersection is confirmed, the vehicle is determined to have exited in the direction of L3.
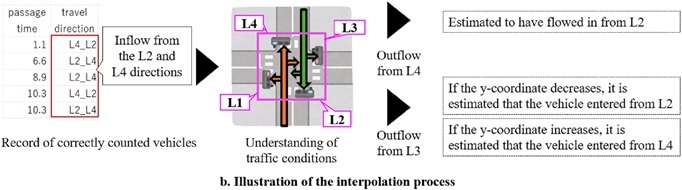
In the interpolation process, vehicles for which the inflow direction cannot be determined are supplemented by estimating their inflow direction, thereby addressing undercounting issues. The flow of this process is illustrated in Fig.3b. First, the inflow direction candidates are estimated for each time point based on the time when the counted vehicles crossed the second cross-sectional line and their travel direction. Next, for vehicles whose inflow direction cannot be determined due to occlusion, the inflow direction is uniquely estimated based on the vector information, including the sequence of timestamps and positions as the vehicle crosses the outflow cross-sectional line.
An example is provided here for the case where a vehicle enters from L2 direction and exits from L3 direction. First, the possible entry direction candidates are estimated based on the time when the target vehicle passed L3 and the time when the correctly counted vehicles passed the second section line. In this example, as shown in Fig. 3b, we assume that vehicles are entering from L2 and L4 directions during this time period. Then, when equation (6) is satisfied, the vehicle is estimated to have entered from the L4 direction, and when equation (7) is satisfied, it is estimated to have entered from the L2 direction. In this case, y2 represents the y-coordinate of the midpoint of the lower edge of the bounding box when the vehicle passes L3, and y1 represents the y-coordinate of the midpoint of the lower edge of the bounding box when the vehicle is first detected within the area enclosed by the section line.

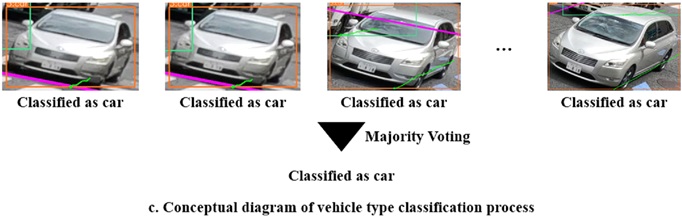
In the vehicle classification process, the counted vehicles are categorized into three classes: car, bus, and truck. The flow of this process is illustrated in Fig.3c. First, the classification results from the YOLOv8x model are recorded for vehicles detected within the area enclosed by the cross-sectional lines. Then, the recorded results are used to determine the vehicle type by applying majority voting to the classification outcomes for each vehicle ID, thereby finalizing the classification.
2.3 Validation of the Proposed Method’s Effectiveness
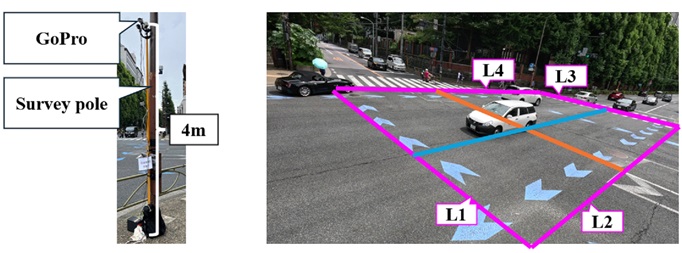
In this study, two validations were conducted to verify the effectiveness of the proposed method. In the first validation, to assess the effectiveness of the interpolation process in the proposed method, we applied both the existing method (Sumiyoshi et al., 2024) and the proposed method to video images of intersections and compared the counting accuracy of turning movement counts. In the second validation, to evaluate the vehicle classification accuracy of the proposed method, vehicle types were classified for the vehicles counted using the proposed method in the first validation. Both validations used video images recorded for 25 minutes at an intersection in Tokyo. The target road consisted of four lanes in total, with two lanes in each direction (see Fig.4). During the recording, approximately 33 vehicles per minute were observed traveling through the intersection. The weather during the recording was cloudy. The video images were captured using a GoPro HERO11 mounted on a survey pole, which was extended to a height of approximately 4.0 meters above the ground. During the recording, the GoPro HERO11 was set to a resolution of 5.3K at 30 fps. In both validations, the number of correctly identified vehicles was verified through manual observation. Precision, recall, and F1-score were calculated to evaluate the performance. However, in Validation 1, vehicles exiting from L1 to L2 and from L3 to L4 had a passage count of zero, making it impossible to calculate evaluation metrics. Therefore, these cases were excluded from the evaluation.
3. Results
3.1 Validation of Counting Accuracy for Turning Movement Counts
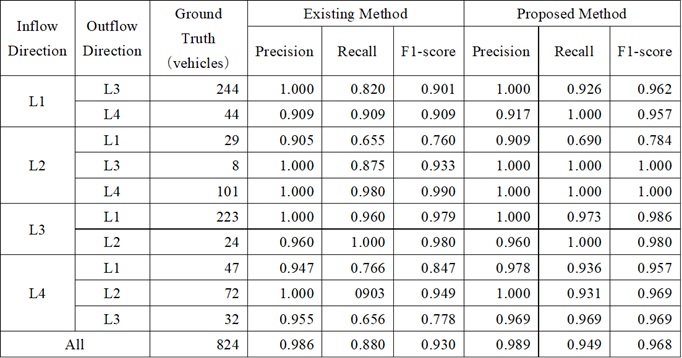
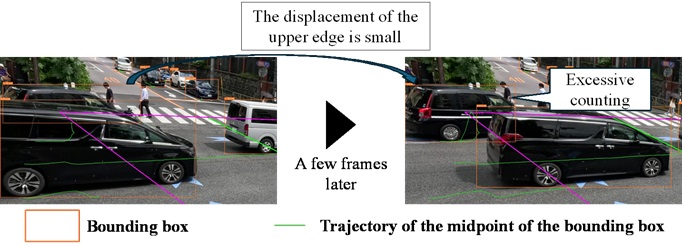
The results of turning movement counts counting are shown in Table 1. First, upon examining the F1-scores, it was found that the proposed method achieved higher scores than the existing method across all directions. Furthermore, in the proposed method, the F1-scores for all directions except for vehicles traveling from L2 to L1 were 0.950 or higher, demonstrating an accuracy comparable to manual observations. Additionally, in the existing method, vehicles traveling in the L3 direction, such as from L1 to L3 and L4 to L3, exhibited low recall rates, indicating a higher incidence of undercounting. The likely cause is that L3 is the farthest cross-sectional line from the camera, making it more prone to occlusion. Similarly, vehicles traveling from L1 to L4 experienced undercounting due to the large number of vehicles traveling from L1 to L3, which caused frequent occlusions. On the other hand, examining the recall rates of the proposed method revealed improvements over the existing method, with vehicles traveling from L1 to L3 achieving a recall of 0.926, from L2 to L3 achieving 1.000, and from L4 to L3 achieving 0.969. Additionally, for vehicles traveling from L1 to L4, the recall rate was 1.000, indicating that detection omissions were successfully mitigated. This indicates that the implementation of the interpolation process in the proposed method, which estimates inflow directions from outflow directions, has the potential to count left-turning vehicles and occluded vehicles, addressing the challenges faced by the existing method. However, for vehicles traveling from L2 to L1, even the proposed method resulted in an F1-score below 0.800. Vehicles traveling from L2 to L1 pass closest to the camera, resulting in their upper sections being visible for only a short duration. This condition led to instances of undercounting. The intersection targeted in this experiment was a large one, with a distance of approximately 70 meters from the camera’s position to the farthest crosswalk. Therefore, depending on the size of the intersection, it can be considered that installing two cameras along the diagonals of the intersection can ensure counting accuracy. Furthermore, for vehicles traveling from L1 to L4, fluctuations in the bounding boxes caused by straight-moving vehicles resulted in excessive counting when the midpoint of the lower edge of the bounding box crossed the sectional line (see Fig.5). In this case, because the straight-moving vehicles travel in front of the vehicles that are excessively counted, the upper edge of the bounding box exhibits less movement compared to the lower edge. Therefore, by focusing on the displacement of the upper edge of the bounding box, it may be possible to achieve improvements.
Table 1. Counting results of directional traffic volume
3.2 Validation of Vehicle Classification Accuracy
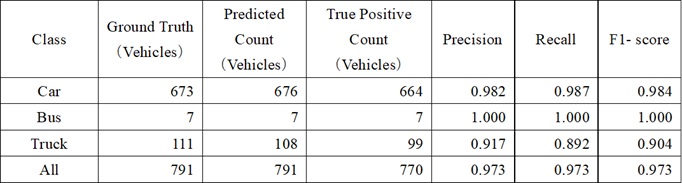
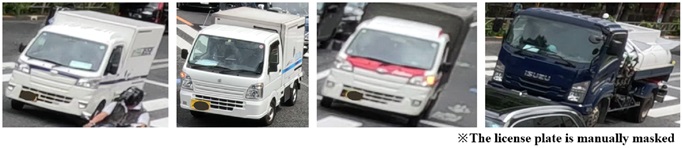
The results of vehicle classification are shown in Table 2. Upon examining the results, it was found that the F1-scores for car, bus, and truck were 0.900 or higher. Furthermore, when aggregating the classification results across all classes, it was found that the F₁-score was 0.973, demonstrating a higher accuracy than the manual counting accuracy of 95.0%. Furthermore, for vehicles that exhibited misclassifications during tracking, it was found that using time-series data allowed for correct classification through majority voting. Upon examining the images where trucks were misclassified as cars, it was observed that such misclassifications occurred predominantly in scenarios where the front of the vehicle was prominently visible. As shown in Fig.6, this issue could potentially be mitigated by collecting images that prominently feature the front view of vehicles and fine-tuning the YOLOv8x model accordingly. Furthermore, among the 12 trucks misclassified as cars, 11 were small-sized trucks. In turning movement counts surveys, it is a common practice to classify vehicles into categories such as small and large vehicles, with cars typically falling under the category of small vehicles. Therefore, from a practical application perspective, these 11 trucks can be considered to have been correctly classified. On the other hand, upon reviewing the images misclassified as trucks, it was found that a significant number featured boxcars. Similar to the case with trucks, this issue could potentially be addressed by creating training data from images containing boxcars and fine-tuning the model accordingly. Additionally, we have demonstrated that the application of deep-learning-based image classification methods enables highly accurate vehicle type classification when measuring cross-sectional traffic volume by vehicle type. Therefore, when measuring turning movement counts by vehicle type, it is considered feasible to classify vehicles into small and large categories by extracting images of vehicles classified as trucks and applying image classification methods.
Table 2. Classification results by vehicle type
4. Conclusion
In this study, a method for measuring turning movement counts by vehicle type was developed using deep learning techniques. The results of the empirical experiments demonstrated that implementing an interpolation process to estimate the inflow direction from the outflow direction improved the counting accuracy for left-turning vehicles and occluded vehicles, which had been a limitation of existing methods. Furthermore, it was demonstrated that, except for one direction, the method achieved a counting accuracy equivalent to or exceeding 95.0%, which is the accuracy level typically achieved through manual measurement. In addition, using the existing YOLOv8x model, the method successfully classified the three classes—car, bus, and truck—with an accuracy exceeding 90.0%. In the future, a method will be devised to prevent overcounting by focusing on the upper edge of the bounding boxes during detection. Furthermore, the generalizability of the proposed method will be validated by applying it to videos captured from various angles and under diverse traffic conditions. Additionally, a method will be developed for measuring turning movement counts separately for small and large vehicles using image classification techniques, aiming for practical application in turning movement counts surveys.
Author Contributions
Conceptualization, Y.Y., M.N., R.S., W.J., D.K., and R.I.; methodology, Y.Y., M.N., R.S., W.J., D.K., and R.I..; software, Y.Y., M.N. and R.S.; validation, Y.Y., M.N., R.S., W.J., D.K., and R.I.; formal analysis, Y.Y., M.N., R.S., W.J., D.K., and R.I.;; investigation, Y.Y., M.N., R.S., W.J., D.K., and R.I.;; resources, Y.Y., M.N., W.J., D.K., and R.I.;; data curation, Y.Y., M.N., R.S., W.J., D.K., and R.I.; writing—original draft preparation, R.S.; writing—review and editing, Y.Y., M.N., R.S., W.J., D.K., and R.I.; visualization, Y.Y., M.N., R.S., W.J., D.K., and R.I.; supervision, R.I.; project administration, R.I.; funding acquisition, Y.Y., M.N., W.J., D.K., and R.I. All authors have read and agreed to the published version of the manuscript.
Funding
This research received no external funding.
Acknowledgments
We would like to express our gratitude to SURVEY RESEARCH CENTER Co., Ltd., CHUO KENSETSU CONSULTANT. Co., Ltd., and NIPPON INSIEK Co., Ltd., for providing us with video images and advice for the practical application of this study.
Conflicts of Interest
The authors declare no conflicts of interest.
References
Aharon, N., Orfaig, R. and Bobrovshy, B, Z. (2022). BoT-SORT: Robust associations multi-pedestrian
tracking. https://arxiv.org/abs/2206.14651
Hamamura, S., Abe, K., Yamane, S. and Nakamura, H. (2023). Development of a real-time cross-sectional traffic volume measurement system using AI. Intelligence, Informatics and Infrastructure, 4(3), 458-465. (in Japanese)
Horii, D., Sugawara H., Kikuchi, Y. and Okubo J. (2022). A study on automatic measurement of precise
traffic engineering indicators volume by intersection direction using deep learning. Intelligence,
Informatics and Infrastructure, 3(J2), 819–825. (in Japanese)
Japan International Cooperation Agency. (2018). Traffic surveys and traffic demand forecasting studies in
developing countries. https://openjicareport.jica.go.jp/pdf/12339867.pdf (in Japanese)
Jocher, G., Chaurasia, A. and Jing qiu. (2023). Ultralytics YOLOv8, https://github.com/ultralytics/ultralytics
Metropolitan Police Department. (2023). Traffic Volume Statistics Table.
https://www.keishicho.metro.tokyo.lg.jp/about_mpd/jokyo_tokei/tokei_jokyo/ryo.html (in Japanese)
Ministry of Land, Infrastructure, Transport and Tourism. (2019). Direction of Traffic Volume and Travel
Speed Survey Utilizing ICT. https://www.mlit.go.jp/road/ir/ir-council/ict/pdf03/02.pdf (in Japanese)
Okubo, J., Sugawara, H., Fujii, J. and Ozasa, K. (2020). Object Tracking on Traffic Counting Improve
Method. Intelligence, Informatics and Infrastructure, 1(1), 235-241. (in Japanese)
Shiomi, Y. (2022). Estimation on Intersection Turning Volume by Using Traffic Detector and Probe Data. Journal of Traffic Engineering, 8(2), A_213-A_221. (in Japanese)
Streetlight Data. (2024). Turning Movement Counts Explained: Leveraging TMC Analytics for Better, Safer Planning. https://www.streetlightdata.com/turning-movement-count-analytics-explained/
Sumiyoshi, R., Imai, R., Yamamoto, Y., Nakahara, M., Kamiya, D. and Wenyuan, J. (2024). Fundamental Study on Automated Counting Method of Turning Movement Counts at Intersections Using Video
Images. Journal of Digital Life. (in Japanese)
Varghese, R. and Sambath, M. (2024). YOLOv8: A Novel Object Detection Algorithm with Enhanced
Performance and Robustness, 2024 International Conference on Advances in Data Engineering and
Intelligent Computing Systems, 10.1109/ADICS58448.2024.10533619
Watanabe, K., Nakano, K., Nakazawa, M. and Naganuma, K. (2023). Development and its evaluation of a counterline optimization method for directional traffic surveys using MOT. Transactions of Information
Processing Society of Japan, 64(2), 511–520. (in Japanese)
Relevant Articles
-

Why do you recall that smelly food? Effects of childhood residence region and potential reinforcing effect of marriage
by Yoshinori Miyamura - 2026,2
VIEW -
Accuracy of peripheral oxygen saturation (SpO₂) at rest determined by a smart ring: A Study in Controlled Hypoxic Environments
by Yohei Takai - 2025,6
VIEW -
An attempt to realize digital transformation in local governments by utilizing the IT skills of information science students
by Edmund Soji Otabe - 2025,4
VIEW -
Fundamental Study on Detection of Dangerous Objects on the Road Surface Leading to Motorcycle Accidents Using a 360-Degree Camera
by Haruka Inoue - 2025,S1
VIEW