

Search for Articles
Special Issue Information Sciences
Research for Supporting Tactical Analysis Concerning Pass Skeleton in American Football
Journal Of Digital Life.2024, 4,S8;
Received:February 19, 2024 Revised:March 14, 2024 Accepted:June 23, 2024 Published:February 26, 2025

- Chihiro Tanaka
- Former Organization for Research and Development of Innovative Science and Technology, Kansai University
- Yuhei Yamamoto
- Faculty of Environmental and Urban Engineering, Kansai University
- Wenyuan Jiang
- Faculty of Engineering, Osaka Sangyo University
- Kenji Nakamura
- Faculty of Information Technology and Social Sciences, Osaka University of Economics
- Shigenori Tanaka
- Faculty of Informatics, Kansai University
- Isao Hayashi
- Faculty of Informatics, Kansai University
- Shinsuke Nakajima
- Faculty of Computer Science and Engineering, Kyoto Sangyo University
Correspondence: y_yamamo@kansai-u.ac.jp
Abstract
The authors have been conducting researches on the measurement and analysis of athletes, things and events in field sports. In particular, we focused on American Football which is the most intelligent and complicated sports, and carried out the possibility of matchup analysis of its pass play. Based on the past researches, it was found that it was possible to estimate success or failure for each play by applying to the time-series trajectory image data of pass matchup players using the CNN(Convolutional Neural Network). However, it is necessary to improve versatility by supporting pass skeletons considering not only one-on-one defense but also formation of zone defense that are close to the match format. Therefore, we aim to support the analysis of pass skeletons, which had to consider huge parameters such as the position and movement of each player from the start of play to the success or failure of the pass. The research was carried out based on a hypothesis that the success or failure of a pass from the position several seconds before the origin of the QB pass throw could be determined by taking into consideration the skill that is the compatibility of each player, the positions and the movement trajectory of the receiver team(WR, TE, and RB), and the defenders(LB,DB,S)that mark them. As a result, the success rate and failure rate of the assumed pass player could be predicted by using the position and its trajectory image of each player from 3 seconds before the pass pitch. And then, by determining that the pass to the maximum likelihood receiver is optimal, we confirmed that useful information can be provided to support strategy planning during the game and guidance during practice.
1. Introduction
Japan Sports Agency (Ministry of Education, Culture, Sports, Science and Technology, 2023b) is promoting support for the success of Japanese national players from a scientific aspect as a priority policy for improving the international competitiveness of Japanese athletes(Ministry of Education, Culture, Sports, Science and Technology, 2023a). This intends to utilize not only ICT (Information and Communication Technology) and IoT (Internet of Things) but also data science. In particular, analysis for player performance and game conditions using quantified numerical values is required. However, these attempts in the field of sports stand at the dawn. In addition to expertise in sports competitions, advanced ICT/IoT operation techniques and data science knowledge are also required. Therefore, it is an urgent issue to increase the number of specialists well informed of the expertise in these areas.
Two of the authors were American football players during their school years. It is not too much to say that coaching in this sport still relies on the experience and intuition of managers and coaches. Recently, though they have come to obtain Stats information of the team and individuals by visually checking the video images captured by video cameras or using dedicated software that enables tagging of video data(Fitness Apollo Company, 2023), advanced data analysis has not been conducted. Thus, we came up with the idea of improving team performance by making full use of ICT/IoT/AI, which have made remarkable progress in recent years, for American football of which the game progresses based on intelligent and complex strategies.
American football is a kind of sports played by 11 players each in the OF and DF; the OF aims to make a touchdown by carrying the ball to the opponent’s end zone in run or pass plays, while the DF is responsible for stopping the OF from doing so. In a game, one play lasts about 10 seconds before the OF is stopped by the DF on every down. The OF and DF teams change when the OF side fails to advance more than 10 yards within the maximum of 4 plays, In particular, the phase often changes dramatically when a successful pass play is made. Therefore, it is important to analyze the movements of the receivers including the QB on the OF side, WR, TE that are both the line and receiver, and RB; the LB on the second string defending the offence of the opponent team on the DF side; the DB on the third string; and the defenders of S.
There are three types of pass-play practice formats: scrimmage, pass skeleton and matchup. A scrimmage is a match-style practice of 11 OFs and 11 DFs on pass and run plays in real-game situations. A pass skeleton is a practice of pass plays without an offensive line (OL) or defensive line (DL) (mainly the defensive formation in a zone defense). And a matchup is a practice of a one-on-one man-to-man defense between the WR and the DB. Matchups are a form of one-on-one, man-to-man defense practice between WRs and DBs. The authors have conducted the research with the long-term goal of analyzing scrimmages, the medium-term goal of analyzing pass skeletons, and the short-term goal of analyzing matchups.
As a first step of our research, we interviewed managers and coaches in the field to find out what kind of items they have been seeking, of which results were roughly classified into four categories (Table 2 in the existing research(Yamamoto, Y., et al., 2018)). Most of them were matters for which quantitative information was required. In particular, focusing on tactical planning to gain an advantage in a game and analytical support for repeated practice of strategies for that purpose, the typical sub-items (1, 4, 7, 12, and 14) can be summarized as follows.
- Acquisition of tracking information on the players and the ball
Sub-item 1) Grasping the position of the players and the distances between them - Classification and recognition of plays
Sub-item 4) Confirmation by reproducing the formation and movements as instructed - Formation Analysis
Sub-item 7) Acquisition of information on formation and Stats of the opponent team - Evaluation of player performance
Sub-item 12) Grasping the compatibility between players on pass plays (e.g., trust between the quarterback (QB) and receivers, or receivers’ awareness that it is hard to deal with the defenders)
Sub-item 14) Predicting the success and failure rates of the play in case that the formations and the movements of the players of one’s own team and the opponent team were obtained
Therefore, the authors have studied methods to satisfy the need in the first main item (Acquisition of tracking information on the players and the ball), which is the greatest core in two approaches. In the first approach, we have discussed possibility of not only visual check made by the manager, coach and players using images taken by the video camera but also their grasping of the positioning of the players, their running courses, and tactical formation as a whole(Jiang, W., et al., 2018; Tanaka, S., et al., 2020). The advantage of this method is that it allows acquisition of information not only about their own team but also about the opponent team. However, due to the nature of American football, it is difficult to accurately identify the locations of players, distinguish them from each other, and track their movement since occlusion occurs because multiple players play closely together.
Recently, on the other hand, as sensing technologies for athletes, things, and events have attracted more attention, IoT devices have become available at affordable prices just like video cameras. Thus, in the second approach, we have been conducting visualization and quantitative evaluation of American football players’ play(Yamamoto, Y., et al., 2018) using the Global Navigation Satellite System (GNSS) sensor “SPI HPU (hereinafter referred to as GPSports)” (4Assist, Inc., 2023), with our focus on its capability of recognizing and tracking players with ease. We have confirmed that the success rate of plays based on the compatibility between players for passing plays agrees with the success rate of plays based on the level of skill (regular or semi-regular) of the players as judged by managers and coaches based on their experience. This shows that the skill and compatibility of players are two sides of the same coin, and that by considering the ability (skill) of each player, it is possible to quantify and analyze the compatibility, such as the ease or difficulty of playing together caused by the combination of players, allowing acquisition of information that coaches want to know and information that is useful for players to review their play. In addition, in soccer, we have also made interviews in the field, As a result, in addition to acquiring numerical data such as running distance and speed, we have conducted a piece of research for visualizing players’ positioning and grasping the ball retention rate(Jiang, W., et al., 2019).
By using this visualization system(Yamamoto, Y., et al., 2018), we were able to establish a foundation for in-depth research on sub-items 1, 4, 7, and 12, which are required by managers and coaches in the field. However, regarding the real-time performance, our research was conducted on the assumption that the communication environment and the functions of communication speed and data volume would improve in the future.
As the next phase, we focused on the sub-item 14, the determination of success and failure. In American football, tactics are constructed from several hundred different plays, and the choice of strategy has a significant impact on the victory or defeat of a game. If a versatile tactical analysis method can be established, it will provide an opportunity to reconsider tactics such as judging the timing of player change, changing play calls, and estimating plays. For this reason, we have paid attention to deep learning and have investigated the automatic acquisition of important information regarding tactical analysis from the characteristics of play by learning measurement data from practice matches and during daily practice. Focusing on passing play, which is the most exciting part of play of the game, we have conducted research with the goal of realizing a new analysis method of supporting tactical planning by estimating the success or failure of a pass, taking into account the skill (compatibility) of players(Yamamoto, Y., et al., 2020; Tanaka, C., et al. 2020).
Therefore, we applied CNN (Convolutional Neural Network) to the trajectory image data of American football pass plays to attempt matchup analysis of the offense (OF) and the defense (DF) (Yamamoto, Y., et al., 2020). Specifically, we verified whether it would be possible to construct a deep learning device for determining the success or failure of a pass play using trajectory image data. As a result, it was found desirable to be able to support the method of detecting the strategy during the play of the assumed game as well. Then, we investigated a method for judging not only the trajectory image of the result of play, but also the situation during a single play, which changes from moment to moment(Tanaka, C., et al. 2020). In specific, we verified the estimation accuracy of the success or failure of a pass by play classification, taking into account the chronological changes in the trajectory information of the players using CNN. As a result, it was confirmed that it is possible to make a matchup analysis in the middle of playing man-to-man defense assuming only the QB, the wide receiver (WR), and the defensive back (DB), allowing to provide useful information to coaches at the actual game level. Two issues have remained that it is not realistic to measure all of the pass plays for each play category and that only match-up plays are covered, both of which are difficult to solve at the same time. It is because the number of combinations of pass patterns becomes enormous when extended to a pass skeleton except OF and DF line members, and that it is almost impossible to reproduce the exact same play as it takes zone defense formation with defensive members including linebackers, DBs, and safeties (S). Furthermore, since the tactical analysis technique is applied to college football, where personnel turnover is frequent, the players of both one’s own team and the opponent team change over a certain period (four years), and consequently the tactics that can be adopted each year are fluid according to the abilities of the players. In addition, because of using the data collected in the first several seconds after the play starts, it is difficult to instantly suggest who is the best target for a pass at any given point after the play starts.
Therefore, with a focus on overcoming these issues, this research aims to predict the success and failure rates of pass in pass plays in the pass skeleton by proposing a versatile analysis method that deals with only the information obtained during the first several seconds of a play, while utilizing a small amount of data obtained from the active players and avoiding being limited by the type of play. In specific, regarding the analysis of the pass skeleton, which conventionally has required consideration of a huge number of parameters such as the position and movement of each player from the start of play to the success or failure of the pass, we conduct a piece of research based on a hypothesis that, setting the time of pass throwing by the QB as the origin point, the pass to the receiver with the maximum likelihood can be determined to be optimal, by taking into consideration the positions and movements of the receivers including the WR, the tight end (TE), and the running back (RB), together with those of the defenders (LB, DB, S) who are marking them, from several seconds before the origin point, as well as the skill (compatibility) of each player which can be inferred by whether both of them are regular players or a combination of regular and semi-regular players. We work for achieving estimation of success or failure of passes based on the positional relationship between the WR and DB at the time the QB throws a pass, which was difficult to achieve in the existing research(Tanaka, C., et al. 2020), and establishing a versatile tactical analysis method for providing the field members with materials that allow them instantaneous decision making of tactics during a game.
2. Related Research on American Football and Positioning of This Research
2.1. Research on Existing Researches
Although there are some examples of ICT applications to American football using IoT devices here and there, most of them are mainly based on video processing and have the same problems of accuracy due to occlusion as in the authors’ attempts(Jiang, W., et al., 2018; Tanaka, S., et al., 2020). First, we take a general view of the contents of related researches along the following items: 1) player and ball tracking(Hayashi, M., et al., 2013; Chen, S., et al., 2015; Kurano, J., et al.., 2013; Kurano, J., et al.., 2015; Arumugam, D., et al., 2013; Catapult, 2023), 2) classification and recognition of play (Intille, S., et al., 1999; Li, R., et al., 2010; Varadarajan, J., et al., 2013; Swears, E., et al., 2012; Chen, S., et al., 2014), 3) understanding formation and its analysis(Tani, T., et al., 2014) and (Atmosukarto, I., et al., 2013), and 4) player performance analysis (Beckwith, G., et al., 2019; Bruke, B., 2019; Dutta, R., et al., 2020; Laviers, K., et al., 2014; Molineaux, M., et al., 2009; Takayanagi, R., et al., 2020; Lee, N., et al., 2016); and then clarify their differences from this research.
2.1.1 Player and Ball Tracking
The researches on player and ball tracking (Hayashi, M., et al., 2013; Chen, S., et al., 2015; Kurano, J., et al.., 2013; Kurano, J., et al.., 2015; Arumugam, D., et al., 2013; Catapult, 2023) can be roughly divided into two types: researches focusing on players (Hayashi, M., et al., 2013; Chen, S., et al., 2015) and researches limited to balls(Kurano, J., et al.., 2013; Kurano, J., et al.., 2015; Arumugam, D., et al., 2013; Catapult, 2023).
The research(Hayashi, M., et al., 2013) on player tracking examines the possibility of tracking by learning HOG (Histograms of Oriented Gradients) feature vectors of players. The research(Chen, S., et al., 2015) proposes a tracking method for dealing with player occlusion by calculating the optimal solution using linear programming based on the number of players detected in the previous frame. However, these researches are still difficult to apply to play analysis due to a problem of accuracy caused by image processing.
The researches on ball tracking(Kurano, J., et al.., 2013; Kurano, J., et al.., 2015; Arumugam, D., et al., 2013; Catapult, 2023) propose methods for tracking the ball using player tracking information. In American football, there are two types of OF attacks: pass plays and run plays, and methods have been proposed to deal with each of them. For example, in the research(Kurano, J., et al.., 2013), the ball is detected using color information for pass plays. When the ball cannot be detected, the previous movement vector is used to estimate its position. Also, in the research(Kurano, J., et al.., 2015), for run plays in which the ball is difficult to detect, the section where the ball could not be detected is interpolated by determining the start and end positions of the play as well as the ball carrier. From another practical point of view, the research(Arumugam, D., et al., 2013) has been conducted to obtain the trajectory and status of the ball using wireless communication technology. Signals transmitted from a wireless communication unit built into the ball are received by the antenna on the field to identify the position of the ball. One product that uses such technology is Catapult Sports’ SmartBall(Catapult, 2023), which is designed for soccer balls. Although ball tracking is excluded from our research subject in a series of our researches at this time, we recognize that it is such a subject that should be required to research without exception.
2.1.2 Classification and Recognition of Play
In the researches on classification and recognition of play (Intille, S., et al., 1999; Li, R., et al., 2010; Varadarajan, J., et al., 2013; Swears, E., et al., 2012; Chen, S., et al., 2014), OF plays are classified based on the movement trajectories of players obtained by image processing. It is expected that this will allow managers and coaches to efficiently grasp formations and their movement patterns and trends, and also to be utilized for play classification and recognition of the opponents’ OF.
The research(Intille, S., et al., 1999) proposes a probabilistic model to recognize actions of a large number of players. The research(Li, R., et al., 2010) proposes a probabilistic model for classifying types of play by tracking players. The research(Varadarajan, J., et al., 2013) classifies plays using template matching from players’ trajectories, and the research(Swears, E., et al., 2012) also attempts to classify plays by learning players’ trajectories. In the research(Chen, S., et al., 2014), the position of a play is inferred not only from the trajectory of the players but also from recognition of white lines, which is useful in play classification.
These researches focus on determination and classification of the types of play by using the position and movement trajectory of the players. Consequently, they do not go as far as determination of whether a play is good or bad, which is the goal of the authors.
2.1.3 Formation Analysis
The researches on formation analysis(Tani, T., et al., 2014; Atmosukarto, I., et al., 2013) include an attempt to develop a visualization system of discovering trends for planning tactical analysis from measurement data obtained in past games(Tani, T., et al., 2014), and a piece of research on automatic recognition of OF teams to determine their formation(Atmosukarto, I., et al., 2013).
The research(Tani, T., et al., 2014) aims to search and visualize similar plays in the past by entering information such as the number of downs, remaining distance, hash (ball position) formation, and play type, on the assumption that play data has been accumulated. However, it is difficult to evaluate plays quantitatively only by searching past plays. The research(Atmosukarto, I., et al., 2013) uses image processing to identify player positions and visualize the scrimmage line and formation.
Focusing on analyzing formations by using the past stats information, these researches do not estimate the quality of play as in the previous section, which is the goal of the authors. In addition, there is a problem with the accuracy of the visualization due to issues with estimating the position of players by image processing.
2.1.4 Player Performance Evaluation
The researches on player performance evaluation(Beckwith, G., et al., 2019; Bruke, B., 2019; Dutta, R., et al., 2020; Laviers, K., et al., 2014; Molineaux, M., et al., 2009; Takayanagi, R., et al., 2020; Lee, N., et al., 2016) can be roughly divided into two types: player evaluation(Beckwith, G., et al., 2019; Bruke, B., 2019) and application to tactical analysis(Dutta, R., et al., 2020; Laviers, K., et al., 2014; Molineaux, M., et al., 2009; Takayanagi, R., et al., 2020; Lee, N., et al., 2016).
The former aims to evaluate players’ skills using their position and trajectory as well as play data. For example, The research(Beckwith, G., et al., 2019) presents overall performance by collecting personal information such as a player’s height and weight, ability information such as speed, and stats information such as the number of touchdowns. The research(Bruke, B., 2019) evaluates quality of the QB based on the action of the QB by having the images of passing moments learned. Thus, both researches did not attain prediction of plays.
The latter provides advantageous information for tactical analysis by analyzing the formations of its own and opponent teams. It also aims to predict the actions of players and teams divided into two types of teams: the OF team and the DF team, and to plan optimal tactics. For example, in the research(Dutta, R., et al., 2020), the trajectory of the DF team viewed from the OF side is used to predict and visualize the pass-coverage probability. The research(Laviers, K., et al., 2014) also predicts the resulting reward (yards gained) based on the trajectory of the opponent player by recognizing the play of the DF in order to evaluate the tactics of the DF. Also, in the research(Molineaux, M., et al., 2009), a method is designed to improve the learning efficiency to achieve the support for the OF action (yards gained) based on the number of defenders and their skills by recognizing the play of the DF. In the research(Takayanagi, R., et al., 2020), based on information such as the position of the plays of the OF and DF as well as the number of downs, a Q-Learning simulation model is used to calculate the reward value of the action depending on to which receiver the QB passes or scrambles and switches to a run play. Consequently, an optimal action pattern is presented. On the contrary, the research(Lee, N., et al., 2016) predicts the play patterns of the WR chronologically from the DF side.
These researches are very similar to what the authors are aiming for. However, they do not take into account the compatibility between the players on the team (sub-item 12), nor do they predict the success and failure rates of the concerned pass play. Therefore, it can be said that these related researches have not yet achieved the goal of sub-item 14).
2.1.5 Discussion of Differences from the Related Researches
The related researches can be summarized as the following needs of 1) accurate tracking of players and balls, 2) easy acquisition of game stats and statistical data of plays, 3) checking whether or not formations and movements have been reproduced as instructed, and 4) obtaining player movements and evaluations of their own and opponent teams. These are consistent with the results of interviews with managers and coaches, and it can be said that there is the same tendency in many researches. However, the following problems remain.
- The results of the analysis lack accuracy because the analysis is limited to that from videos, which cause a large number of problems with tracking accuracy.
- Accuracy of the position of the players and their distances from each other are not ensured. Furthermore, the analysis does not take into account the degrees of skill (compatibility) of the players.
- Prediction of success and failure rates of the pass skeleton in Sub-item 14) is not realized.
Therefore, the related researches do not guarantee the accuracy of the results of the play analysis, and it is difficult to say that they have been able to implement the needs of the managers and coaches with high accuracy that the authors are aiming for. Furthermore, it is considered that there are no researches that have realized sub-item 14) that take account of sub-items 1, 4, 7, and 12.
2.2 Necessity of This Research
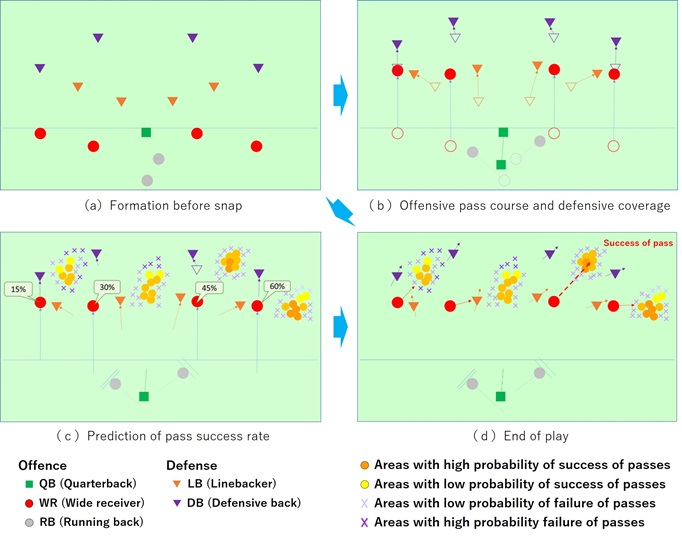
The current phase of our research is still limited to analytical support for matchups(Yamamoto, Y., et al., 2020; Tanaka, C., et al. 2020). In the case of assuming a pass skeleton, as shown in Figure 1(a), the play patterns that are developed from the offensive formation of the QB and receivers (WR, TE and RB) are a combination of multiple pass plays and are very complex and varied. In addition to the man-to-man defense, there are also numerous defensive formations of zone defense (LB, DB, S), depending on the play patterns of OF. In specific, it is desirable to be able to predict the areas of successful and unsuccessful passes in Figure 1(c) from the position of the receivers catching the pass and that or defenders in seconds after the position of Figure 1(b), taking into account the OF formations and play calls (play types) shown in Figure 1(a) and the defensive formations of the DF. Based on the difference from the play result of Figure 1(d), if this makes it possible to present the materials for instantly determining whether there is DF in the pass course of the receiver, in which area it is easy for the receiver to catch the ball, and in what timing the QB should make a pass, and most importantly, who is the optimal target in consideration of the skill level (compatibility) of the players, this will lead to “new insights” and thus bring advantageous information to the field.
3. New Proposal to Support Pass Skeleton Analysis
3.1 Significance of Proposal
As the first step(Yamamoto, Y., et al., 2020), we analyzed the success or failure of passes of matchup by the QB, WR and DB by considering the tracking information of the completed play and the skill level (chemistry) of each player. As the second step(Tanaka, C., et al. 2020), we determined the success or failure of the passes during play by using the information from the chronological movement history. These researches have indicated that support information for matchup analysis, which is our short-term goal, can be provided.
Therefore, this research aims to extend to the pass skeleton, which is our medium-term goal. In supporting pass skeleton analysis, there are three types of information that instructors are seeking quantitatively: 1) Whether or not there is a point and timing for QB to throw a pass for each pass pattern, and timing for the receivers that become targets including the WR, TE, or RB to take the course and catch the ball with time to spare. 2) Confirming the area that is covered or to be covered by mapping the movements of the receivers and the defenders including the LB, DB and S. And 3) the determination criteria of the QB prior to release, changes in the movement of the defenders at the time of release, and the positional relation of respective players just before the play is decided and its outcome. In addition, the skill level (compatibility) of each player inherent in these three items is very important. Taking all of these factors into account, it is significant to estimate comparison of the course for the receiver to take when making a successful pass with that for an unsuccessful pass, the defender’s response at that time, and the success and failure rates of the target receiver’s passes.
3.2 Problem of Proposal
Furthermore, since the subject of this research is college football, unlike semi-professional teams, various adverse effects occur. Specifically, the first team (regular) consists of about 10 OF and 10 DF players respectively, and the second team (semi-regular) consists of 20 to 30 players respectively. However, 25% of the team members are replaced every year. Moreover, since the offensive and defensive rotations are frequent in American football as its playing characteristics, players may change for every play depending on the tactics. Therefore, the time that the OF is on offense in a game is about one hour. However, as half of these plays are run plays, which are not included in this research, it is necessary to develop a technology that can be used even with a small amount of data.
3.3 Overview of Proposal
In order to build a model that predicts the success or failure of a pass, the authors investigated a method(Tanaka, C., et al. 2020) for generating trajectory images (Figure 2, left) as learning data from the movement history of all players according to play classification. Specifically, the study focused on determining the optimal patterns for the color, width, and length of the trajectories. However, In the method(Tanaka, C., et al. 2020), it is very difficult to obtain the success/failure rates of countless pass plays for each receiver, as shown in Figure 1(d). Therefore, we propose a method that focuses only on the information about the few seconds preceding the pass timing during the play (Figure 2 right) so that it is not limited by the play classification (play type). There is no need to classify the plays because the proposed method uses trajectory images of a certain number of seconds from the pass timing during the play. Furthermore, estimation is made by extracting the trajectories of the QB, the target WR, and the DB that mark them out of the trajectories of the players participating in the play, there is no need to ask whether it is man-to-man defense or zone defense, making the method highly versatile that deals with pass skeleton. At the same time, it is a method that kills two birds with one stone as it can predict the success and failure rates of a pass play. Therefore, regarding the analysis of the pass skeleton, which conventionally required consideration of a huge number of parameters such as the position and movement of each player from the start of the play to the success or failure of the pass, particularly as to the prediction of the success or failure rate of the pass in the pass play in Figure 1 (c), based on the hypothesis that it is possible to determine it by taking account of the positions and movements of the receivers from several seconds before the origin point, which is the time when the QB throws a pass, and those of defenders who are marking the receivers; and the skill level (compatibility) of each player, we propose a new method to enable judgment that the pass to the receiver with the maximum likelihood is optimal.
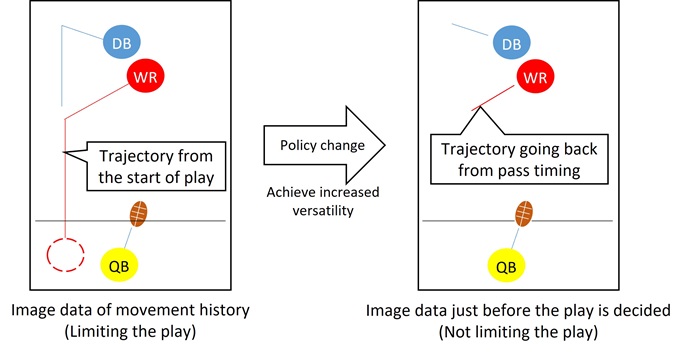
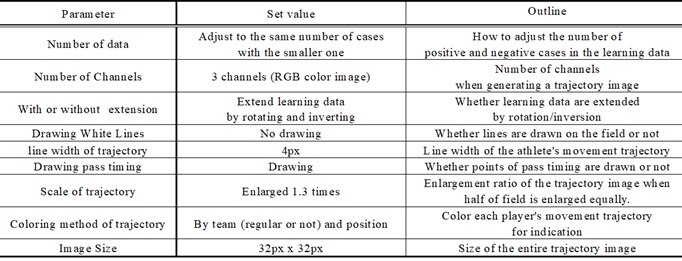
Table 1. Optimal parameters for trajectory image data
4. Experiments for Examining the Method of Generating Trajectories
4.1 Experiment Outline
The purpose of the experiment is to verify the hypothesis described in Section 3.3 that the success or failure of the pass play can be determined by the trajectory image that takes the account of the player’s position and movement trajectory from several seconds before the time of the pass throw and the skill level of each player.
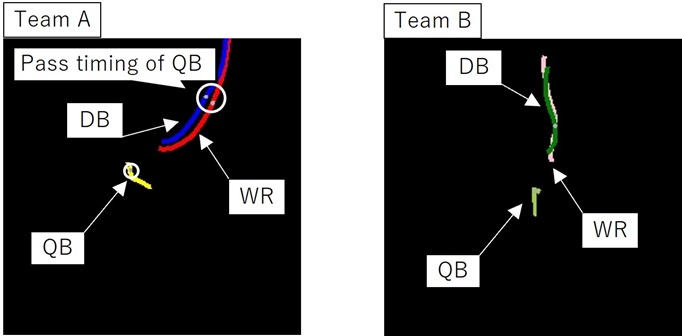
Existing researches (Yamamoto, Y., et al., 2020; Tanaka, C., et al. 2020) proposed the parameters for generation of trajectory images as shown in Table 1. It was found that the success or failure of pass can be accurately estimated by generating trajectory images (Figure 3) using the optimal set values after parametric analysis. In the trajectory images generated by this method, regular players (Team A) and semi-regular players (Team B) are distinguished by the color of their trajectories, giving meaning to the skill level of respective players simultaneously. Therefore, in this research, we also conduct experiments using trajectory images based on the knowledge above.
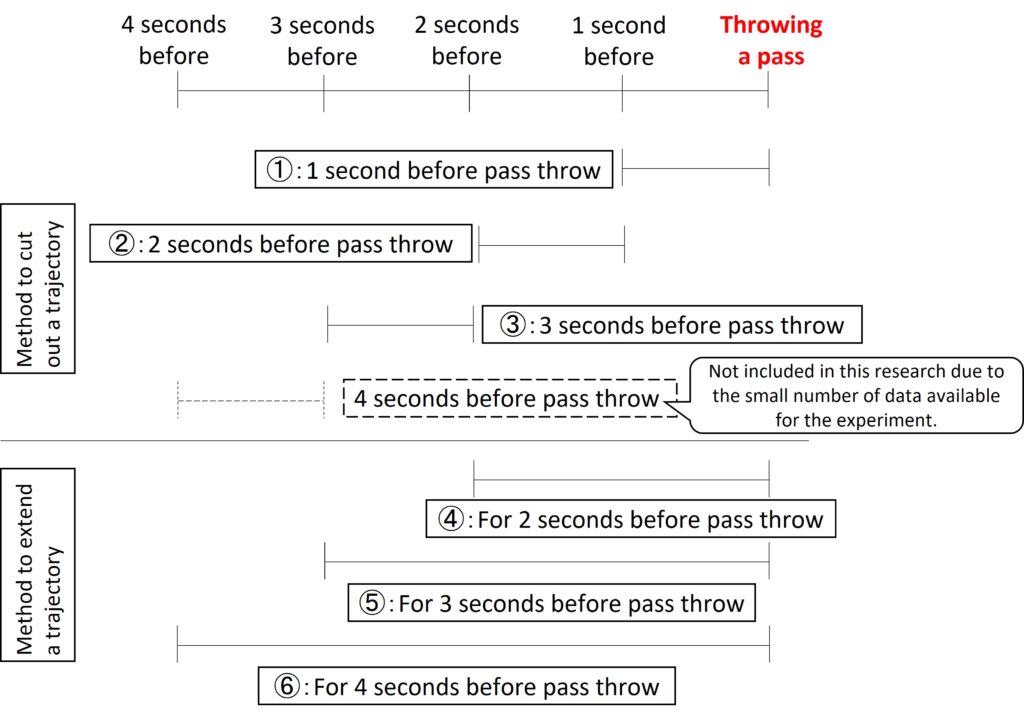
As shown in Figure 4, it is considered that there are two methods of generating trajectory images that takes account of the time series with the timing of throwing pass as the origin: trajectories cut out at regular intervals (1 second in this research), and trajectories extended at regular intervals. The former (Figure 5, left) allows estimation using the characteristics of the moment of action, while the latter (Figure 5, right) allows estimation using the characteristics of changes in action. In this experiment, we verify which method is optimal using the trajectory images generated with both methods and validating the accuracy of each method. In existing researches (Yamamoto, Y., et al., 2020; Tanaka, C., et al. 2020), an F-measure of 0.600 is set as the target accuracy for determining the success or failure of a pass, as an accuracy that is in line with field experience, based on interviews with people who have experienced American football. Therefore, this research also follows this approach and sets an F-measure of 0.600 as the target accuracy.
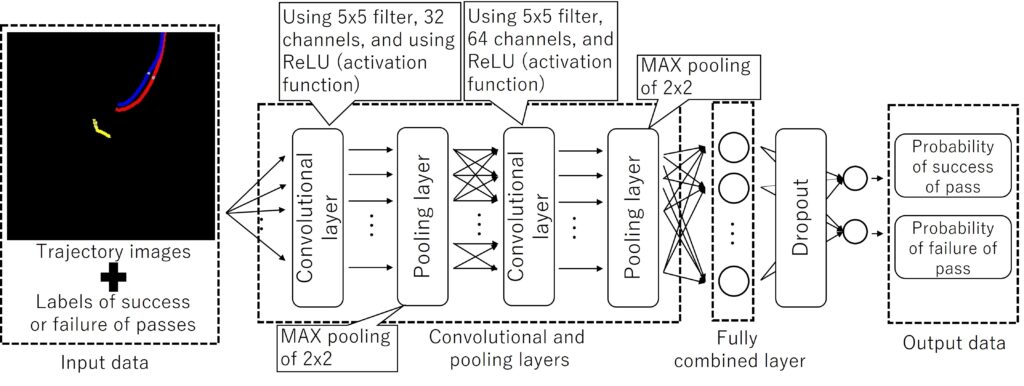
Similar to existing research(Tanaka, C., et al. 2020), the deep learning device used in this experiment is a partially modified version of the network used in the recognition program for handwritten numeral images by TensorFlow (Figure 6). Specifically, the number of units in the input layer is set to match the size and number of channels of the generated image, and the number of units in the output layer is set to 2 units to match the success or failure of pass (2 classifications). This CNN finally outputs the likelihood of belonging to each class of success or failure of pass.

4.2 Preparation of Experimental Data
The majority of passing plays in American football tend to be completed in approximately 3 to 4 seconds. Therefore, in this experiment, we generate trajectory images using positional information going back 1 to 4 seconds from the timing of the pass throw as its origin. The number of seconds to go back is set by taking into account the time required for the QB to receive the snap from the center of the OL and throws the ball.
The data used in this research are shown in Table 2. These data were obtained with the cooperation of the American football team of Kansai University, using GNSS sensors(4Assist, Inc., 2023) to measure practices at the Senriyama campus of Kansai University. Since the support for pass skeleton analysis in this research targets college football, it is assumed that players change every spring and fall season, unlike professional and semi-professional teams. Thus, it is required to decide the number of data according to the period of time the players can play in games and the total number of pass plays made in each game, and to make analysis with the limited amount of data.
Table 2. Number of plays for each dataset
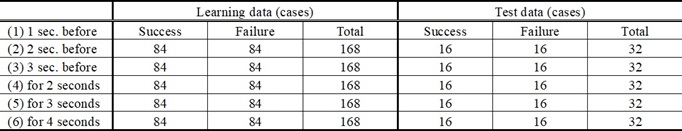
Since college football players can only be registered for four years and approximately 25% of the members change every year, the capability of making determination with limited number of data is also a novelty of the proposed method.
4.3 Experimental Procedure
The procedure of this experiment is shown in the following steps.
STEP1: Prepare two datasets for the two methods of cutting out trajectories and extending trajectories.
STEP2: Prepare 10 datasets for each second at random. At this point, in each dataset for each second, the learning data and the test data shall be trajectory images obtained from the same play.
STEP3: In each dataset for each second, construct a model from the training data, and make 10 trials to determine the success or failure of pass using the test data. The number of learning trials is set to 3,000, which is the number of times that existing research(Tanaka, C., et al. 2020) have shown a trend toward learning convergence.
STEP4: Calculate the success (positive example) and failure (negative example), as well as the overall precision, recall, and F-measure.
STEP5: Select one of the 10 sets with the best accuracy, then compare and verify both methods of cutting out the trajectory and extending the trajectory.
4.4 Experimental Results and Discussion
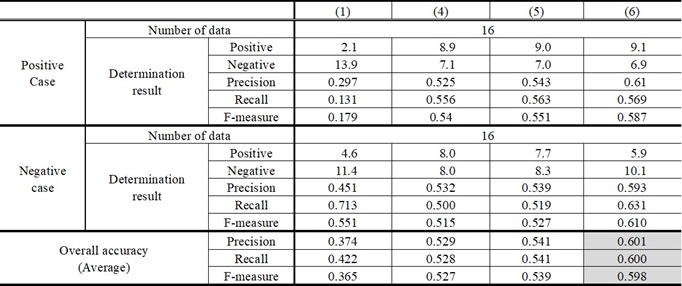
Table 3 shows the results of the method for cutting out the trajectory for every second, and Table 4 shows the results of the method for extending the trajectory. (1) through (6) of Tables 3 and 4 correspond to (1) through (6) of Fig. 5, and Table 4 (1) is the same as Table 3 (1).
The results of the method of cutting out the trajectory for every second (Table 3) shows that although the accuracy improved as the number of seconds increased from the pass timing, the F-measure of the overall results was about 0.500 (0.499). In all cases, there is a bias toward positive or negative cases. As can be seen also in Figure 5, this is probably because the trajectory in the image is short, and the color of the drawn trajectory is more strongly affected than the shape. Therefore, the method of cutting out the trajectory every second does not sufficiently capture the chronological characteristics of the trajectory, and it is considered necessary to extend the time for cutting out.
On the other hand, the results of the method of extending the trajectory (Table 4) show that the accuracy improves as the number of seconds increases, and that the F-measure (approximately 0.600), which is on the same level with to the accuracy when considering the movement history in the existing research(Tanaka, C., et al. 2020). In addition, Table 4 shows that no bias occurred in the determination results for both positive and negative cases. Therefore, it was found that the chronological characteristics of the trajectory were captured as in the existing research(Tanaka, C., et al. 2020).
Table 3. Experimental results of methods to extract trajectory: No.1 to 3
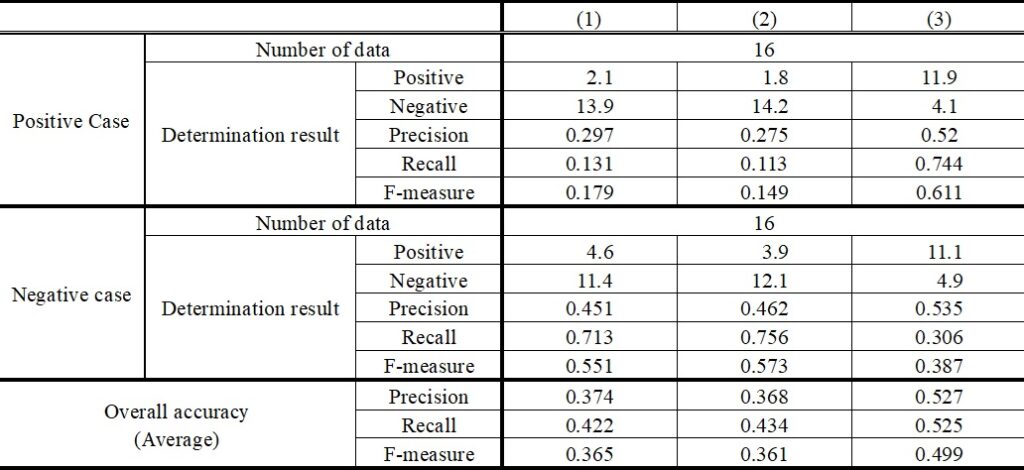
Table 4 Experimental results of methods to extend trajectory: No.4 to 6
From the above, it was found that it is more effective for improving accuracy to use characteristics with chronological changes than instant characteristics. Thus, we attempt to analyze tactics using a trajectory extension method in this research.
5. Verification of Versatile Analytical Support for Pass Skeletons
5.1 Experimental Outline
In Chapter 4, we tested two methods that take account of time series and confirmed the accuracy of each method. As a result, it was found that success or failure of pass can be determined while the play is in progress by generating a learning model using the method of extending the trajectory. However, the actual plays take different amounts of time depending on the movements of the QB, WR, and DB. Furthermore, the length of a play (number of seconds) varies depending on the type of pass, such as short, middle, and long passes. Consequently, the collected data may be biased by the length of each play, resulting in variations in the determination of the trajectory image. Therefore, in this experiment, we verify the usefulness of a model that has learned all the data instead of a learning model that learns every second in order to keep the learning model at constant accuracy. Then we validate the versatility of the generated learning model and discusses its applicability to tactical analysis in the real field.
5.2 Preparation of Experimental Data
In this experiment, we verify the accuracy of the learning model using all of the trajectory images extended with different number of seconds. Specifically, the model is generated by learning all data from 2 to 4 seconds before the pass which is the point of origin as shown in Table 5.
5.3 Experimental Procedure
In this experiment, we use the model that has learned the data consisting of 84 examples for each of positive and negative cases x 3 seconds (2, 3, and 4 seconds) (Table 5) used in Chapter 4 to verify the accuracy of the success or failure of the pass of the test data for each number of seconds (16 data for each). The accuracy is calculated in the same way as in section 4.3.
Table 5. Datasets of final examination
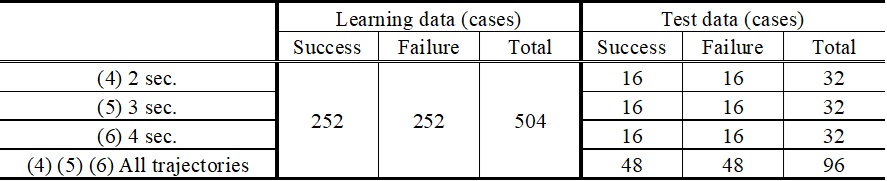
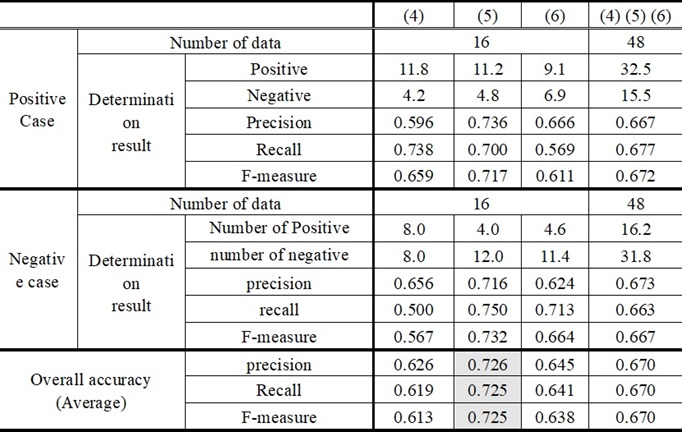
Table 6. Final experimental results
5.4 Experimental Results and Discussion
The results of this experiment are shown in Table 6. The overall accuracy shown in Table 6 indicates that success or failure of pass can be determined more accurately than the existing research(Tanaka, C., et al. 2020) by using all of the proposed learning data. In particular, the F-measure of 0.725 was the highest in the 3 seconds from 3 seconds before the throw (5). This indicates that the trajectory at the 3 seconds before the throw has the characteristics related to the success or failure of pass most strongly. On the other hand, the accuracy decreased in the 2 seconds (4) and 4 seconds (6). This may be due to the lack of characteristics necessary for determination in the 2-second period, and to the difficulty in generating an accurate model in the 4-second period because of the small number of plays over a long period of time. Further, the columns of “(4), (5), and (6)” in Table 6 show that the accuracy for all data (from 2 sec. to 4 sec.) is 0.670, indicating that there is no variation or bias in the accuracy for the positive and negative cases, and that it is possible to determine the success or failure of pass with a certain degree of accuracy. From the above, it is considered that determination is made possible with sufficient accuracy compared with the target accuracy in the existing researches(Yamamoto, Y., et al., 2020; Tanaka, C., et al. 2020) set in this research.
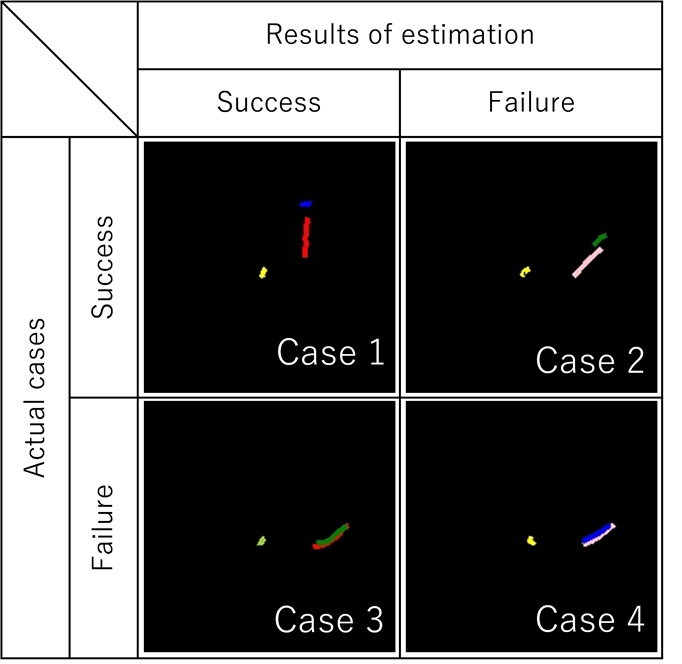
Four cases (Figure 7) are taken from the determination results and analyzed in detail. Case 1 is a case where success was determined as success. Case 2 is a case where success was determined as failure. Case 3 is a case where failure was determined as success. Case 4 is a case where failure was determined as failure.
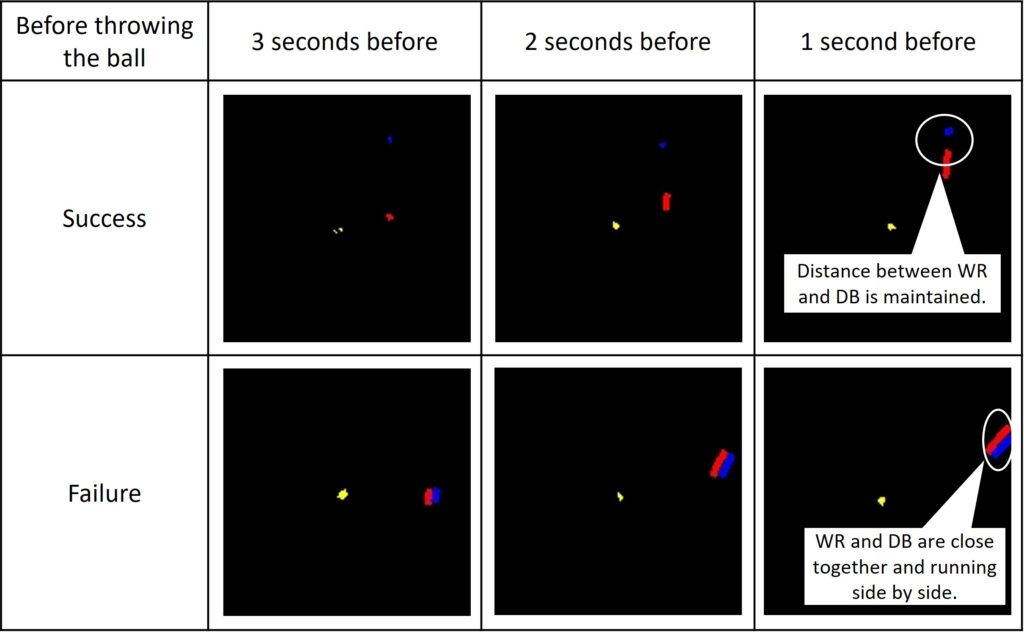
First, we analyze Case 1 and Case 4, which are determined correctly. In general, the trajectories of successful and unsuccessful passes have the characteristics shown in Figure 8. For example, in the case of success, the positions of the WR (red trajectory) and the DB (blue trajectory) are far apart, and furthermore, the two players are not running alongside in view of their actions. In the case of failure, the WR and DB are positioned side by side and they have such characteristics as to run side by side all the time. The same tendency is observed in Case 1 and Case 4. In Case 1, the trajectories of the WR and the DB are apart from each other, and the WR succeeds in receiving the pass without any interference from the DB. In Case 4, the trajectories of the DB and WR overlap because the DB runs parallel to the WR in close proximity, showing a characteristic that prevents the WR from receiving the pass easily.
On the other hand, there are special cases such as Cases 2 and 3. In Case 2, as in Case 1, the WR and the DB were apart from each other, and the ball could be received. However, compared to Case 1, misdetermination occurred because the end point of the WR’s trajectory and the starting point of the DB’s trajectory were close. In Case 3, the WR was running along beside the DB, but overtook the DB at the end. In this case, the distance between the two players is different in comparison with Case 4. However, it is considered that misdetermination occurred because there seemed no difference in characteristics due to the number of pixels in the image.
The results of the above analysis indicate that the proposed method allowed learning the characteristics of success or failure of passes shown in Figure 8, and it was found that the method is useful for tactical analysis of pass skeletons. This means that the proposed learning data and learning method are highly practical, as success or failure of pass can be determined with no variation and with the same or higher accuracy compared with the existing research(Tanaka, C., et al. 2020) by using only the trajectory image of the point shortly before the play is decided. The proposed method is also highly versatile because it does not use information on the entire play and does not require play classification.
6. Achievement Level Check and Significance of New Insight Information
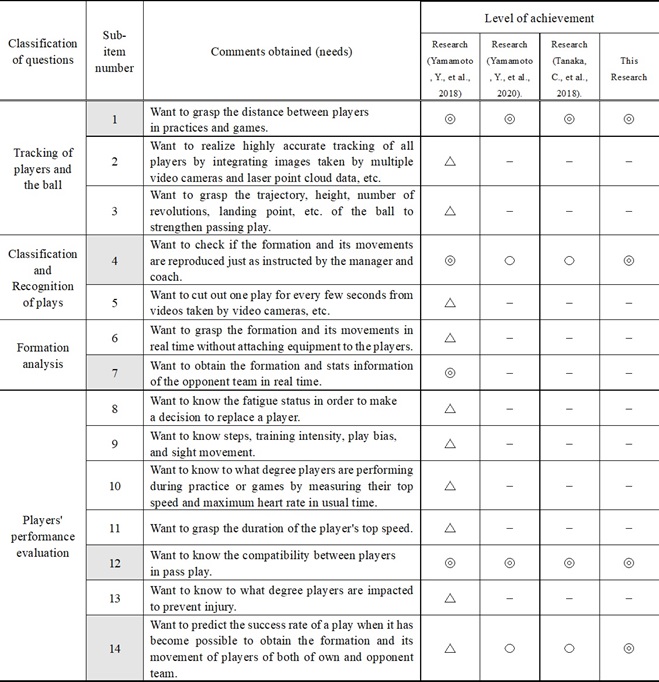
In this research, based on the needs of the managers and coaches (Table 2 in the existing research(Yamamoto, Y., et al., 2018)), we check the achievement level of the goals together with the coaches in the field. In addition, we mention the usefulness of the information gained from the achieved items that serves as new insight.
6.1 Checking Achievement Level
Table 7 summarizes the achievement level of the research results so far, including what has been realized (◎), approximately half achieved (○), and partially achieved (△).
First, what we were able to realize with the visualization system of the existing research(Yamamoto, Y., et al., 2018) are the sub-items 1, 4, 7, and 12 in Table 7. First, it has already been confirmed with the coaches that the following are made possible: 1) Grasping the distance between the players during practice or a game, 4) Confirmation of the formation as instructed, 7) Acquisition of stats information of the opponent team, and 12) Analysis of difference between regular and semi-regular players. In existing researches(Yamamoto, Y., et al., 2020; Tanaka, C., et al. 2020), it has also been demonstrated that it is possible to estimate the success or failure of passing match-up plays mainly from the information of 1) and 12), and the usefulness of this method has been evaluated. However, regarding 7), it is difficult in official matches because it is not allowed to have the opponent team wear GNSS sensors. Using the video analysis method, it is necessary to develop researches(Jiang, W., et al., 2018; Tanaka, S., et al., 2020) further to improve the accuracy of positions, recognition, and tracking of players.
Second, from the results of the passing skeleton that assumed the game format of this research, we confirmed with the coaches that 4) the formation and movements were reproduced accurately as instructed by the manager and coaches, and that 7) that the formation and movements of the opponent team during practice and practice games could also be reproduced as well. Furthermore, using all of the information from 1), 4), 7), and 12), we were able to predict the success and failure rates of passes based on the information in the 3 seconds before the QB throw in 14).
The time period of 3 seconds before throwing a pass is almost the same as the timing when the QB receives the snapped ball after the play begins, completes the drop back motion to throw the pass, determines the pass target, and throws the pass; therefore, decision making of throwing a pass at this time is very important. The instructor also gave his view that the information at this time was useful and valuable enough as a material for analytical support.
We received his opinion that in the future, when predicting the plays in item 12), he expects improvement in the prediction accuracy by taking account of the receivers’ and defenders’ awareness of being bad at something converted into numerical values by quantitatively evaluating the degrees of skills of the receivers, including the QB, and the trust between players not limited to regular and semi-regular players, , as well as by quantifying the stats information of the opponent team in 7). We also received a comment that in the future, it is desired to accurately obtain information of the opponent team during a game from videos taken with a video camera etc. and present support information for tactical analysis in real time.
6.2 Significance of New Insight Information
This research has been conducted for the purpose of presenting information that managers and coaches are seeking. In particular, its goal has been to contribute to improving the quality of practice by using this information. In concrete, the quantitative presentation of useful information for coaches leads to support material for formulating tactics and gaining new insight. Such information, for example, includes which plays are effective, which zones to target, which players in the own team have high ability, the compatibility between players, and the condition of players during games and practices. By applying the results of this research to pass skeleton, it will be easier for the QB to be aware of what is the timing and where to throw the ball to increase the success rate, and for the WR to be aware of what is the timing and how to run in relation to the position of defense to secure a wider area for a successful pass.
Table 7. Research achievement for leader’s needs
“-” indicates items that need further examination by introducing other devices, including video cameras.
In addition, even the excellent coaches are unsure about the next play call. It is because the situation of each player and the game situation (Table 2 in the existing research(Yamamoto, Y., et al., 2020)) are not always the same, and accordingly, decisions tend to be based on experience and intuition rather than logical thinking. Consequently, if the future can be predicted from past data regarding the rights and wrongs about the selection of the subsequent play and its success or failure, the current problem can be solved. It can be considered that in the future, it will be possible to select appropriate plays with a high degree of accuracy by collecting players’ positional information in real time and storing it in the learning device.
From the above, we were able to reconfirm the significance and importance of the newly perceived insightful information together with managers and coaches. We believe that the advancement of sports information processing will allow the level to improve from qualitative understanding of meaning to quantitative one for those who play, watch, support, and entrust sports, and consequently that sports will transform from an “unplotted drama” with contingency into a “predictable drama” with necessity in the near future.
7. Future Outlook
There are roughly four parts we plan to develop in the future.
For the first part, we will extend the maximum likelihood in order to connect to the first down and touchdowns. In the pass skeleton, when we created a CNN success/failure determination device using the trajectory images of OF and DF, we obtained a determination rate of over 70% using the determination device in which the trajectory images from 3 seconds before throwing the pass were input. As a result, for each play in the pass skeleton, the success rate of the pass was estimated using this determination device for the assumed player to receive the pass, enabling determination that the pass to the receiver with the maximum likelihood was optimal. However, since we have given the highest priority to visualization of trajectory images for the coaches, which has been the research policy so far, we have been adopting CNN. Although CNN is good at analyzing fixed-length data, the amount of data increased due to the need to work out in order to take time into account. While it is possible in this method to predict success or failure based on the distance between players, the skill of each player, and the skill levels (compatibility) between players, it is difficult to predict the maximization of results such as where the receiver receives the pass while considering the speed of the receiver, and how far the receiver can advance after receiving the pass while maintaining his speed and breaking away from the defenders. Thus, using Recurrent NN, which is advantageous in being variable so that it can take account of time, and simple because of dealing with only position coordinates, we are planning to confirm that this brings about the results as good as or better than the results obtained using information from 3 seconds before the QB’s passing time as the point of origin, then consider the information quantified for improving the prediction accuracy in 6.1 Section, and finally examine the maximum likelihood of the results in depth.
For the 2nd part, we will conduct a piece of research for supporting the analysis of scrimmages for game-style pass plays and for all plays to be assumed including run plays. At the same time, we plan to examine the use of image processing to obtain ball tracking information.
For the third part, we will progress a piece of research on the analysis method using video images in parallel, and also examine real-time data in depth. Moreover, we plan to obtain other kind of information that managers and coaches want to know by using new sensor devices in combination. For example, we are planning to use a biometric sensor to obtain heart rate and fatigue level etc., and to use image processing together with the biometric sensor to obtain the number of steps taken by the athlete as well as training intensity and so on.
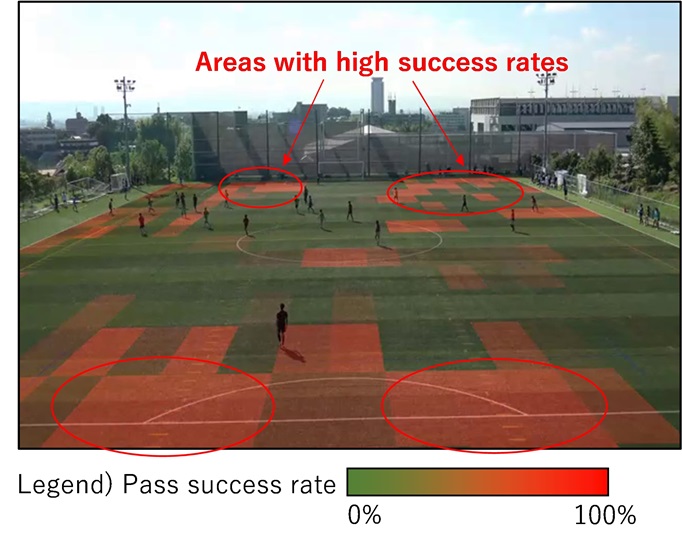
Furthermore, for the fourth part, also in other field sports, we research application to plays in which the ball is passed, such as soccer, track and field hockey, and lacrosse. These require the player to maintain continuity while passing to an open space with eye contact. In particular, more passes of good quality will lead to a goal(Power, P., et al., 2017). Therefore, in any given situation, creation of a heat map to show the zones(Figure 9) where pass success or failure probability is high based on the information about the position and movement trajectory of all players for several seconds before the pass will lead to an improvement in the ball retention rate(Jiang, W., et al., 2019) and provide useful information that the coaches seek.
These four parts will be pursued in future researches.
8. Conclusion
The authors have been examining whether it is possible to determine success or failure of pass matchups(Yamamoto, Y., et al., 2020; Tanaka, C., et al. 2020) by applying CNN to trajectory image data of American football pass plays. The idea, which is the starting point for these researches, was that there was a need to accurately visualize whether the players are accurately taking the right course of the play. Then, it was necessary to confirm the information on the completion of the play and to judge whether the play was good or bad. However, it is very difficult even for managers and coaches to determine whether a play is good or bad.
Thus, regarding prediction of success or failure of passes in the pass skeleton that has conventionally required consideration of diverse parameters such as the positions and movements of respective players from the point of starting the play to the success or failure of the pass, as well as the skill level (compatibility) of the players, we have conducted this research on the assumption that it is possible to determine success or failure by focusing on the movement trajectory of the receivers and the defenders marking them from several seconds before the time when QB throws the pass as the point of origin. Then, we have created a deep learning device for success/failure determination using the information about the trajectories and the positions of passes of the QB, receivers and defenders, as well as information on the skill level of the players (regular or semi-regular) in which the compatibility between the players is inherent. As a result, we have obtained the determination rate that exceeds 70% using the determination device into which the trajectories from 3 seconds before throwing a pass are input. Consequently, we have confirmed that useful information can be provided to support strategical planning during games or coaching during practice, since this determination device allows prediction of the success or failure rate of pass to the assumed passer for each play in the pass skeleton, indicating that the pass to the receiver with the highest likelihood is determined as optimal. Such prediction results can be used for feedback after the match and for planning tactics using intercom during the match. On the other hand, the accuracy of the prediction results depends on the training data, so high accuracy can be achieved when using data from one’s own team, and accuracy will decrease when using data from other teams.
From the above, this research has shown new knowledge and views in the area of information processing in sports. In addition, this research is expected to contribute to the application or development of new technologies such as judgment of the use of players at the critical point of a game, by not only visualizing players’ movements but also giving quantified numerical information including the estimation results of success or failure of passes that take the skill level (compatibility) of the players into account. This information is expected to contribute to the application and development of new technologies, such as decisions on the use of players at the critical point of a game. At the same time, we have obtained results that contribute to practical “Sports x ICT” for solving advanced problems in the real world.
This paper was translated and written based on the technical reports published by the Image Lab (Tanaka, C., et al. 2022b, Tanaka, C., et al. 2022a).
Author Contributions
Conceptualization, S.T., I.H. and S.N.; methodology, Y.Y. and K.N.; software, W.J. and C.T.; validation, W.J. and C.T.; formal analysis, Y.Y., K.N., W.J. and C.T.; investigation, W.J. and C.T.; resources, S.T., I.H. and S.N.; data curation, W.J. and C.T.; writing—original draft preparation, W.J. and C.T.; writing—review and editing, S.T., K.N., I.H., S.N., Y.Y. and W.J.; supervision, S.T., I.H. and S.N.; project administration, S.T., I.H. and S.N.; funding acquisition, S.T., I.H. and S.N.
Funding
This research was funded by Kansai University
Conflicts of Interest
The authors declare no conflict of interest.
References
4Assist, Inc.(2023). GPS System SPI HPU, http://4assist.co.jp/gpsports/gpsports_top2.html.
Arumugam, D., Sibley, M., Griffin, J., Stancil, D. and Rickeets, D.(2013). An Active Position Sensing Tag for Sports Visualization in American Football. International Conference on RFID, 96-103.
Atmosukarto, I., Ghanem, B., Ahuja, S., Muthuswamy, K. and Ahuja, N.(2013). Automatic Recognition of Offensive Team Formation in America Football Plays, Conference on Computer Vision and Pattern Recognition Workshops, 991-998.
Beckwith, G., Callahan, T., Carlson, B., Fondren, T., Harris, R., Hoege, J., Martin, T., Menna, C., Summer, E., Scherer, W., Tuttle, C. and Adams, S.(2019). Systems Analysis for University of Virginia Football Recruiting and Performance, Systems and Information Engineering Design Symposium, 1-6.
Bruke, B.(2019). DeepQB: Deep Learning with Player Tracking to Quantify Quarterback Decision-Making & Performance, MIT Sloan Sports Analytics Conference.
Catapult(2023). Find Your Football Fingerprints, http://www.catapultsports.com/sports/football/.
Chen, C., Lai, W., Hsieh, H., Zheng, W., Wang, Y. and Chuang, J.(2018). Generating Defensive Plays in Basketball Games, MM ’18, Proceedings of the 26th ACM international conference on Multimedia, 1580-1588.
Chen, S., Feng, Z., Lu, Q., Mahasseni, B., Fiez, T., Fern, A. and Todorovic, S.(2014). Play Type Recognition in Real-World Football Video, Winter Conference on Applications of Computer Vision, 652-659.
Chen, S., Fern, A. and Todorovic, S.(2015). Person Count Localization in Videos from Noisy Foreground and Detections, Conference on Computer Vision and Pattern Recognition, 1364-1372.
Dutta, R., Yurko, R. and Ventura, S.(2020). Unsupervised Methods for Identifying Pass Coverage Among Defensive Backs with NFL Player Tracking Data, Journal of Quantitative Analysis in Sports, 143-161.
Hayashi, M., Yamamoto, T., Aoki, Y., Ohshima, K. and Tanabiki, M.(2013). Head and Upper Body Pose Estimation in Team Sport Videos, 2nd IAPR Asian Conference on Pattern Recognition, 754-759.
Hudl(2025). hudl Japan Official Website, https://jp.hudl.com/ja.
Intille, S. and Bobick, A.(1999). A Framework for Recognizing Multi-agent Action from Visual Evidence. Proceedings of the National Conference on Artificial Intelligence, 518-525.
Jiang, W., Yamamoto, Y., Nakamura, K., Tanaka, S., Tanaka, C., Masaki, H., Yamada, T., Fujimoto, Y. and Naruo, T.(2019). Research and Development of Coach Oriented Visualization System for Field Sports, IPSJ Journal, 60(5), 1212-1227.
Jiang, W., Yamamoto, Y., Tanaka, S., Nakamura, K. and Tanaka, C.(2018). Research for Identification and Positional Analysis of American Football Players Using Multi-Cameras from Single Viewpoint, Journal of Japan Society of Photogrammetry and Remote Sensing, 57(5), 198-216.
Kurano, J., Hayashi, M., Yamamoto, T., Oshima, K., Tanabiki, M. and AOKI, Y.(2015). Ball Tracking in American Football Video Using Information of Play Initial and Terminal Points and Each Player’s Movement, Journal of the Japan Society for Precision Engineering, 81(1), 91-98.
Kurano, J., Yamamoto, T., Hayashi, M., Kataoka, H. and Aoki, Y.(2013). Creation of Pass Success Probability Map for Sports Video Analysis, ITE Technical Report, 37(36), 45-48.
Laviers, K. and Sukthankar, G.(2014). Using Opponent Modeling to Adapt Team Play in American Football, Plan, Activity, and Intent Recognition, pp. 313-341.
Lee, N. and Kitani, K.(2016). Predicting Wide Receiver Trajectories in American Football, Winter Conference on Applications of Computer Vision, 1-9.
Li, R. and Chellappa, R.(2010). Recognizing Offensive Strategies from Football Videos, International Conference on Image Processing, 4585-4588.
Ministry of Education, Culture, Sports, Science and Technology(2023a). Establishment of Sports Agency and Promotion of Sports Policy, https://www.mext.go.jp/sports/b_menu/soshiki2/1373916.htm.
Ministry of Education, Culture, Sports, Science and Technology(2023b). Japan Sports Agency, http://www.mext.go.jp/sports/.
Molineaux, M., Aha, D. and Sukthankar, G.(2009). Beating the defense: Using Plan Recognition to Inform Learning Agents. Proceeding of the Twenty-Second International Florida Artificial Intelligence Research Society Conference, 337-343.
Power, P., Ruiz, H., Wei, X. and Lucey, P.(2017). Not All Passes Are Created Equal: Objectively Measuring the Risk and Reward of Passes in Soccer from Tracking Data, International Conference on Knowledge Discovery and Data Mining, 1605-1613.
Swears, E. and Hoogs, A.(2012). Learning and Recognizing Complex Multi-agent Activities with Applications to American Football Plays, Workshop on the Applications of Computer Vision, 409-416.
Takayanagi, R., Malla, D., Sakai, T. and Sogabe, T.(2020). Research on American Football Coaching Strategy Using Deep Reinforcement Learning, Annual Conference of the Japanese Society for Artificial Intelligence, 34.
Tanaka, C., Yamamoto, Y., Jiang, W., Tanaka, S., Hayashi, I., Nakamura, K. and Nakajima, S.(2022a). Research for Supporting Tactical Analysis Concerning Pass Skeleton in American Football -Demonstration Experiment-, Image Laboratory, 33(4), 24-34.
Tanaka, C., Yamamoto, Y., Jiang, W., Tanaka, S., Hayashi, I., Nakamura, K. and Nakajima, S.(2022b). Research for Supporting Tactical Analysis Concerning Pass Skeleton in American Football -Survey and Proposal-, Image Laboratory, 33(3), 27-34.
Tanaka, C., Yamamoto, Y., Jiang, W., Tanaka, S., Nakamura, K. and Nakajima, S.(2020). Research for Pass Matchup Analysis Considering Movement Records in American Football, Journal of Japan Society for Fuzzy Theory and Intelligent Informatics, 32(1), 580-589.
Tanaka, S., Yamamoto, Y., Jiang, W., Nakamura, K., Seio N. and Tanaka, C.(2020). Research for Tracking Athletes Using Images Shot from Multiple Points of View, Journal of Japan Society for Fuzzy Theory and Intelligent Informatics, 32(4), 821-830.
Tani, T., Huang, H., and Kawagoe, K.(2014). Visualization System for Play Strategy Decision Support Using Trajectory Mining, The 6th Forum on Data Engineering and Information Management, E1-6.
Varadarajan, J., Atmosukarto, I., Ahuja, S., Ghanem, B. and Ahuja, N.(2013). A Topic Model Approach to Represent and Classify American Football Plays, British Machine Vision Conference, 64.1-64.12.
Yamamoto, Y., Tanaka, S., Jiang, W., Nakamura, K., Tanaka, C. and Seio, N.(2018). Development of Visualization System and Positional Play Analysis for American Football, IPSJ Journal, 59(5), 1334-1350.
Yamamoto, Y., Tanaka, S., Nakamura, K., Tanaka, C., Jiang, W. and Hayashi, I.(2020). Research for Matchup Analysis of Pass Play in American Football with Deep Learning, Journal of Japan Society for Fuzzy Theory and Intelligent Informatics, 32(1), 590-603.
Relevant Articles
-

Why do you recall that smelly food? Effects of childhood residence region and potential reinforcing effect of marriage
by Yoshinori Miyamura - 2026,2
VIEW -
An attempt to realize digital transformation in local governments by utilizing the IT skills of information science students
by Edmund Soji Otabe - 2025,4
VIEW -
Wildlife Approach Detection Using a Custom-Built Multimodal IoT Camera System with Environmental Sound Analysis
by Katsunori Oyama - 2025,S2
VIEW -
Research on Indoor Self-Location Estimation Technique Using Similar Image Retrieval Considering Environmental Changes
by - 2025,S3
VIEW