

Search for Articles
The relationship among skills/factors and their structure and wins/losses in games in basketball classes
Journal Of Digital Life.2022, 2,3;
Received:January 14, 2022 Revised:January 27, 2022 Accepted:February 24, 2022 Published:March 4, 2022

- Ken Nagamine
- Faculty of Health and Sports Science, Fukuoka University
- Osamu Aoyagi
- Faculty of Health and Sports Science, Fukuoka University
- Akihito Yaita
- Faculty of Sports Science, Kyushu Kyoritsu University
- Ikuo Komure
- Faculty of Health and Sports Science, Fukuoka University
- Tsuyoshi Kawazura
- Faculty of Sports Science, Kyushu Kyoritsu University
- Shinya Tagata
- Hitachi High-Tech Cougars
- Tomohiro Annoura
- Japan University of Economics
- Yasufumi Ohyama
- National Institute of Technology, Sasebo College
Correspondence: knaga@fukuoka-u.ac.jp
Abstract
This study aimed to extract the structure of plays/fouls of basketball games in university PE classes using MDS and to investigate the relationship between wins/losses and their structure using logistic regression analysis in the games. Targeted games were 20 games performed in university PE classes at F-university and the plays/factors observed were assessed by a 5-point scale. The items observed were 52 items chosen from “Passing,” “Dribbling,” “Shooting,” “Rebounding,” “Fast break,” “Cooperative plays,” “Violations,” and “Fouls.” After the principal component analysis was applied to the whole data, the items that did not show significant loadings were removed from the analysis, and a correlation matrix among only the items that had significant principle loadings was computed. Another principal component analysis was performed and the principal component scores for each skill/factor were computed. Nonmetric MDS was applied to the correlation matrix, a two-dimensional space was extracted, and the rotation of axes by Varimax criterion and clustering by hierarchical cluster analysis were applied to the two-dimensional space. Finally, logistic regression analysis to predict wins/losses was carried out using skills/factors including gender and evaluators to remove their influence as independent variables. As a result, the following results were obtained:
1) The two-dimensional space obtained was interpreted as “Individual skills and skills leading to fouls/violations” and “Individual – group skills.” Again, the four clusters obtained were also named “Ball-advancing individual skills,” “Under-basket individual skills,” “Cooperative skills,” and “Against-rule and unskilled plays.” 2) Although the likelihood ratio test of logistic regression analysis with all independent variables was not significant, the test of the model after the independent-variable selection was significant, in which “Shooting,” “Cooperative plays,” “Fouls,” and “Gender” were included. In the univariate analysis using correlation ratios, “Dribbling,” “Shooting,” and “Cooperative plays” were significant, but “Fouls” were not. It is thought that “Dribbling” lost its significant relationship with wins/losses when removing the influence of “Cooperative plays,” and insignificant “Fouls” in the univariate analysis showed an important impact on wins/losses because the fouls provided the change of offense and the risk of a losing score increased.
keywords:
1. Introduction
Many studies examining factors influencing wins/losses in basketball games where outstanding players played have been conducted and a relatively large number of researchers indicated 2-point shooting, 3-point shooting (Oida and Shimada, 1969; Tamaki, 2007; Yaita and Nodera, 2007), defensive rebounds (Goto and Iwaki, 2006; Okamoto, 1989), assist (Maeyama, 1996; Sampio and Sebastina, 2004), and others as decisive plays for game outcomes. However, in the case of junior players, the common playing characteristics of “little dribbling,” “fast break with only two players,” and “frequently found fouls” that were not found in outstanding players were detected (Koh et al. ,2011; Ortega et al., 2006). This fact enables us to easily deduce that lower level players produce largely different outcomes and suggests conducting further research. Another common characteristic among researchers was that they used (canonical) discriminant analysis (Dillon and Goldstein, 1984) which is a multi-variate technique. As the reason that not just t-tests, but discriminant analysis is also used is that they aimed to investigate the relationship between independent variables (a variety of factors assumed to influence game outcomes) and a dependent variable (game outcome) while statistically holding other independent variables constant. Although significant association is frequently found in plays that are not independently performed with each other in the sequence of the game, the use of discriminant analysis has the advantage of taking this relationship into consideration. Also, when investigating comprehensive factors, since we must handle many variables/factors, it is sometimes hard to put the findings obtained together. For this reason, studies exist that already examine the structure of plays to summarize the relationship of the factors of interest (Ohga et al., 1990; Sakai et al., 1998). As procedures to extract the structures, they have used factor analysis or multidimensional scaling (MDS; Takane et al., 1977; Young and Torgeson, 1967). Then, many studies extracted the factors corresponding to three types of score getting that they have in common, i.e., 2-point shooting, 3-point shooting, and free throw (Kodama et al., 2010; Kodama and Suzuki, 1990; Suzuki and Kodama, 1988).
Incidentally, basketball games are performed in basketball classes in PE classes, of which one of the characteristics of the training is to make an effort to win games with poor skills. For instance, although skilled players advance the ball while using short and frequent passing in which many players are involved, it is sometimes effective and safe for unskilled players to perform dribbling, not passing, with only a few players because conducting frequent passing leads to making many errors in proportion to the number of plays. Also, skilled players are spread out evenly all over the court, as reflected in the strategies of “making a space, running into the space, and receiving the ball (Shimada, 1992)” which are utilized. However, at the level where high-level strategies cannot be use, many players gather around the ball regardless of being offensive or defensive players, i.e., being crowded together in what is called “Dango-jyotai” in Japanese. Many researchers focused on this “Dango-jyotai” as a critical factor in learning to progress from unskilled to skilled conditions (Hirose et al., 2012; Nakanishi et al., 2003; Sakakibara, 1994). Also, with the structure of skills, although a sequence of plays with a scoring pattern was found in skilled players, which is brought about by strategic factors, these strategic play patterns cannot be expected from unskilled players, and only a skill structure based on individual skills can be expected.
As such, since the factors affecting wins/losses are different depending on skill levels, it can be easily expected that the actual conditions of the games in PE classes are different from games involving skilled players because of the poor skills of the players in the PE classes. For this reason, the extraction of factors influencing wins/losses in PE class games and examination of their relationship with wins/losses provide us good information about what should be taught to unskilled players in PE classes, and the class curriculum can be studied based on these findings.
Thus, this study aimed to examine the relationship between skills/factors and wins/losses in PE basketball games in which unskilled players played, after extracting the structure of plays/skills and fouls using the MDS that traditional studies have utilized. However, although almost all the traditional studies used discriminant analysis, which has the limitation of normality and homoscedasticity, this study used a logistic regression model (Hair et al., 2010) which is most effective in a two-group classification.
2. Methods
2.1 Games observed and observations/assessments
Taping video of 20 games held in basketball PE classes at F-university, the frequencies of the following observation items were counted/assessed. Two evaluators assessed the plays of the students. One was a coach of a female basketball team at a university and a holder of a license A certified by the Japan Basketball Association. The other was a male university coach who has an official license B. At the same time, game outcomes were also recorded.
2.2 Observation/assessment items for skills/factors
As the main individual and group skills in basketball games, roughly the six domains of passing, dribbling, shooting, rebound, fast break, and cooperation plays were assumed (Kimura, 1986; Seki, 1974). Furthermore, the two domains of fouls and violations were also included because useless illegal plays also give the opponents the chance to get a score, which is one of the characteristics of unskilled players. That is to say, whether the following 52 plays/factors were found or not was checked: six passing plays, specifically: “Desperate passing,” “Vertical long passing,” “Horizontal passing,” “Passing to change the offensive side,” “Passing to reorganize an offensive line,” and “Passing attacking opponents’ carelessness;” six dribbling plays, namely “Dribbling while watching the ball,” “Dribbling while protecting the ball,” “Dribbling while looking around,” “Changing direction while dribbling,” “Breaking through while dribbling,” and “Going away while dribbling;” five shooting plays, specifically “Dribbling and shooting,” “Lay-up shooting,” “Long-range shooting,” “Mid-range shooting,” and “Shooting after dodging the opponent;” five rebounding plays made up of “Rebounding by one player,” “Rebounding by two players,” “Trying to get the inside position,” “Rebounding by three players,” and “Jumping into a rebound by dodging the opponent,” nine fast-break plays, namely “A player who was the first to hold the ball and carried it by dribbling,” “A player who is good at ball-handling carried the ball,” “The ball was carried by passing,” “The ball was carried by a straight-line dribble,” “The ball was carried by dribbling,” “The ball was carried with dribbling while shaking the defensive players off,” “Consistently getting the basket when the offensive players were outnumbered,” “Three-line fast break,” and “A successive/secondary offense from a fast break;” eight cooperative plays consisting of “Outlet passing,” “Pass-and-play,” “A cooperative play with a post man,” “A ball screen play,” “A cooperative play between two specific players,” “A cooperative play by two specific players,” “A cooperative play by three specific players,” and “A ball screen play among three players;” eight violations comprised of “Traveling when catching the ball,” “Traveling when passing,” “Traveling when moving to receive the ball,” “Travelling when faking,” “Traveling when stopping,” “Line crossing,” ”Double dribbling,” and “3-second over time;” and five fouls, namely “Body contact when trying to rob the ball,” “Body contact when trying to steal,” “Body contact when trying to stop the opponent drive,” “Body contact when competing the position,” and “Fouls or charging against shooting.” Each item was assessed using a 5-point scale: 5: very good; 4: good; 3: unknown; 2: bad; and 1: very bad. A five-point scale was employed to obtain a more detailed evaluation.
2.3 Statistical analysis procedures
2.3.1 Compound scores of skills/factors
First of all, in order to make a comprehensive evaluation of each skill/factor, principal component analysis was conducted, and the first principal component structure loadings were computed. If the loadings were not significant, principal component analysis was computed again after removing the skills/factors because the skills/factors were not reflected in the principal component. Then, principal component scores were computed from skills/factors with only significant loadings.
2.3.2 Extraction of the structure of skills/factors
In order to investigate the structure of skills/factors, after computing a correlation matrix, dissimilarity was computed using the following translation into the correlation. Then, nonmetric multidimensional scaling was applied:
Dij = (1-rij)1/2,
where Dij stands for dissimilarity and rij for correlation coefficient.
The nonmetric multidimensional scaling was conducted using the function of “sammon” in R. The number of dimensions was determined by the change of stress. Subsequently, clustering was conducted by using hierarchical cluster analysis into the configuration obtained. Interpretation of not only clusters but also axes was conducted using Varimax rotation (Harman, 1976).
2.3.3 Association between wins/losses and skills/factors
In order to investigate the association between eight skills/factors and wins/losses, whether the association existed from the significance of correlation ratios or not was first examined. Next, to examine the relationship after holding other skills/factors constant, logistic regression analysis was conducted using wins/losses as a dependent variable and eight skills/factors as independent variables. However, in order to remove the influence of gender and evaluators, they were also included as independent variables. Moreover, independent variables were selected to find variables with more contribution to wins/losses after considering the interaction with each other. Independent variables were included or removed using the criterion of the probability of the Wald test being 0.2. The correct and incorrect discrimination rates due to logistic regression analysis after the selection was computed using a cut-off point in which the ROC curve was close to the upper–right corner, the point of the horizontal axis was 0, and the vertical axis was 1.
3. Results
3.1 Principal component analysis to obtain composite scores of skills/factors
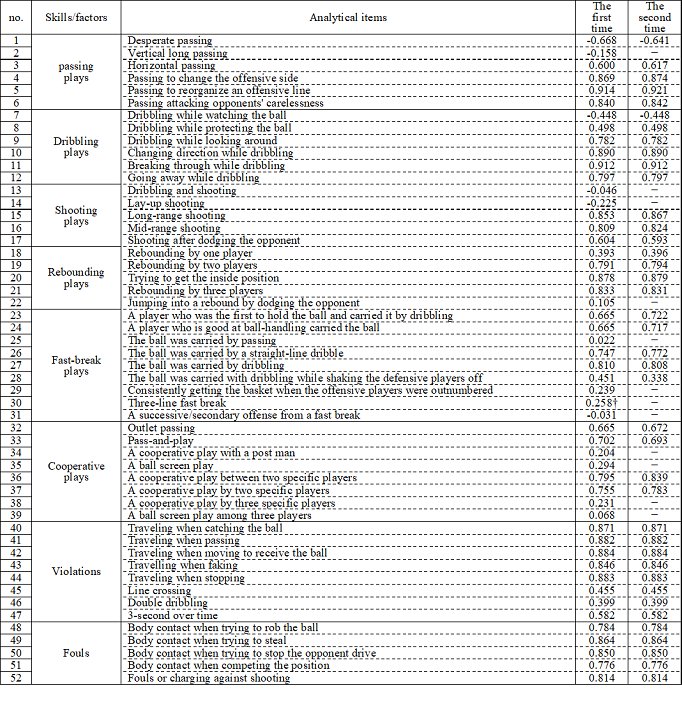
The principal component loadings are shown in Table 1. Principal component analysis by skill/factor showed no significant loadings less than 0.3 in “Vertical long passing (-0.158)” for passing; “Dribbling and shooting (-0.046)” and “Lay-up shooting (-0.225)” for shooting; “Jumping into a rebound by dodging the opponent (0.105)” for rebounding; “The ball was carried with passing (0.022);” “Consistently getting the basket when the offensive players were outnumbered (0.239);” “Three-line fast break (0.327 for the first time, but 0.258 for the second time);” “A successive/secondary offense from a fast break (-0.031)” of a fast break; “A cooperative play with a post man (0.204);” “A ball screen play (0.294);” “A cooperative play by three specific players (0.231);” and “A ball screen play among three players (0.068)” in cooperative plays.
Table 1. Principal component loadings
3.2 Configuration of skills/factors
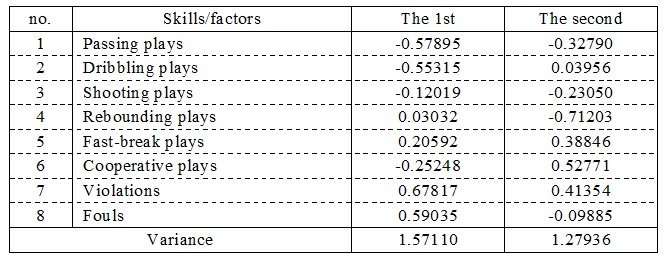
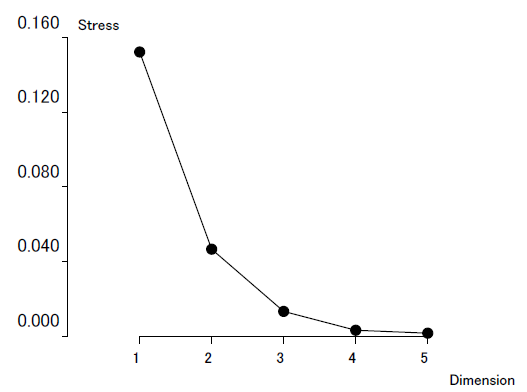
Since the first principal component scores had the highest correlations with variables used, it can be thought that the first principal component scores influenced the characteristics of the skills/factors. Thus, after computing the correlation matrix among them, nonmetric multidimensional scaling was applied. Figure 1 shows the change of stress from the first to fifth dimensions. As the number of dimensions increased from the first dimension to the third dimension, stress rapidly decreased, in which the tendency was not found in the third dimension or later. In short, the elbow was found in the third dimension so a two-dimensional solution was adopted. Table 2 is the coordinates of skills/factors, by which the two-dimensional space for them is drawn as in Figure 2.
Table 2. The coordinates of MDS configuration after Varimax rotation
3.3 Interpretation of skills/factors
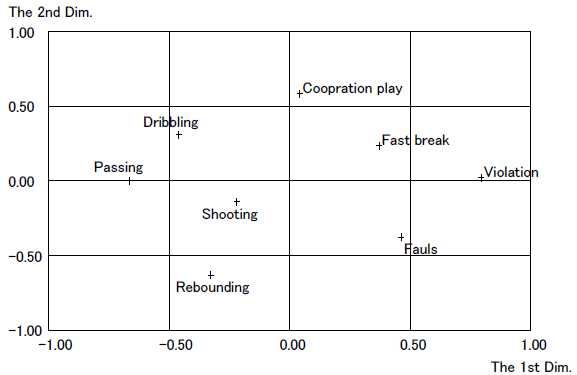
The results of the hierarchical cluster analysis using the Ward method that was applied to the two-dimensional configuration are indicated by the dendrogram in Figure 3. At the same time, an interpretation of the two axes was also conducted. Figure 4 is the rotated configuration onto which the clustering was superimposed.
Hierarchical cluster analysis allowed us to produce four clusters: Cluster 1, in which dribbling and passing skills were included; Cluster 2, which included shooting and rebounding skills; Cluster 3, in which only cooperative plays were categorized; and Cluster 4 for fast breaks, violations, and fouls.
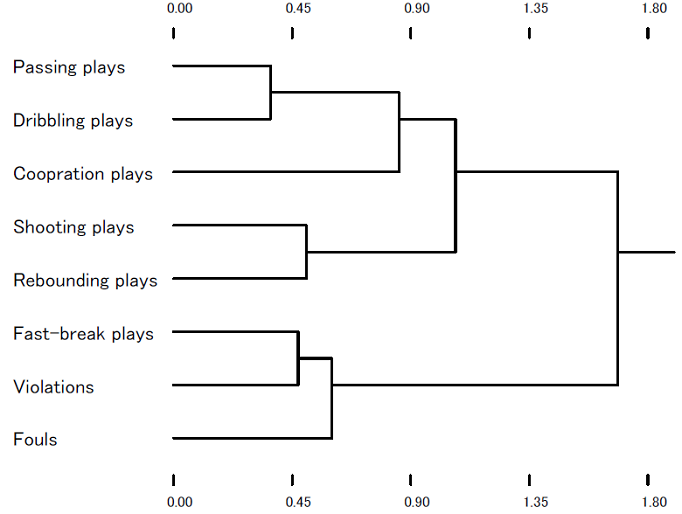

Cluster 1 was interpreted as “Ball-advancing individual skills” because both dribbling and passing skills were the skills to advance the ball. The fact that both shooting and rebounding skills are individual skills under the basket allowed us to interpret Cluster 2 as “Under-basket individual skills.” Cluster 3 should be named “Cooperative skills” because the cluster was comprised of one skill. In Cluster 4, violations and fouls that violated the rules were included. It is thought that violations were caused by unskilled plays or that ignorance of rules or fouls was caused through body contact with the opponent because the players could not control their bodies well. Again, fast breaks performed using a vertical long pass without involving hard work and elaborate ball advancing where many teammates cooperated in the process was not seen. This fact allows us to consider that the reason why these fast breaks, violations, and fouls were categorized into one cluster was that the lack of skills was the common factor. Thus, this cluster was named “Against-rule and unskilled plays.”
Also regarding the axis interpretation, since skillful ball advancing by individuals (Cluster 1) and violations or fouls by unskilled plays or body control (Cluster 4) were found at both ends of the first dimension, the horizontal axis was interpreted as “Individual skills and skills leading to fouls/violations.” The vertical axis was named “Individual – group skills” because there were individual shooting and rebounding skills performed under the basket and cooperative plays reflecting group skills at both ends of this axis.
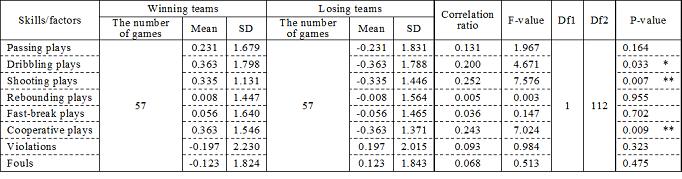
3.4 Relationship between wins/losses and skills/factors investigated individually
Table 3 shows the correlation ratios (etas) and the results of significant tests of them with means and standard deviations of each skill/factor by wins/losses. Significant correlations were found in dribbling (eta = 0.200, p<0.05), shooting (eta = 0.252, p<0.01), and cooperative plays (eta = 0.243, p<0.01), in which any of the winning teams had higher skill scores compared to the losing teams.
Table 3. Correlation ratios between wining/losing and skills/factors
3.4 Relationship between wins/losses and skills/factors holding the influence of other skills/factors constant
Subsequently, in order to investigate the relationship between wins/losses and skills/factors that held the influence of other skills/factors as well as gender and evaluators constant, logistic regression analysis using the eight skills/factors as independent variables and wins/losses as a dependent variable was conducted. Table 4 shows the results when using all independent variables. Although the Wald test indicated that cooperative play was significant at the level of 5%, this model was not significant because the -2 log-likelihood of the model including only constant (Null model) was 158.04 and that of the model including all variables (Full model) was 140.42 and chi-square = 17.62,df= 11, p=0.091.
Table 4. Logisistic regression analysis with all variables
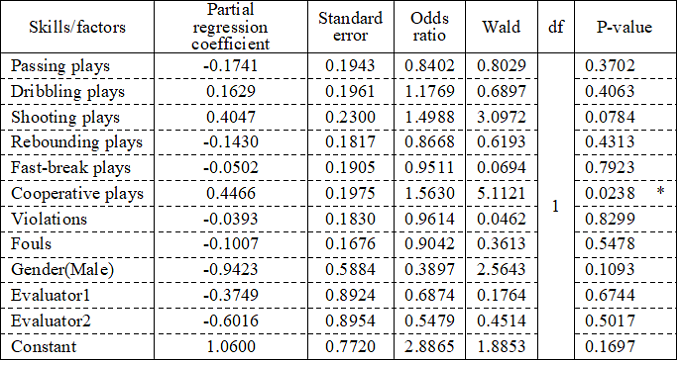
Note: *: significant at the 5% level
Then, to find skills/factors with a higher contribution while considering mutual interaction, the independent variables were selected, during which inclusion or removal was repeated using the criterion of p=0.2 in the Wald test. The results are shown in Table 5.
Table 5. Logisistic regression analysis after variable selection
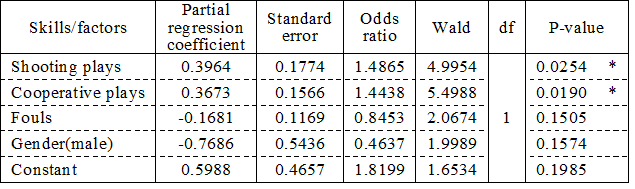
Note: *: significant at the 5% level
-2 log-likelihood of the model with only constant (Null model) was 158.04 and that of the model after variable selection (Full model) is 142.77, and the likelihood ratio of them was chi-square =15.26,df= 4, p=0.0042. In short, the model including only variables with high contribution was significant at the 1% level. Selected skills/factors were shooting, cooperative plays, fouls, and gender. The Wald tests indicated that shooting and cooperative plays among them were significant at the 5% level. Table 6 shows the odds ratios between partial regression coefficients. Shooting had 1.03 times higher contribution to wins/losses compared to cooperative plays, 1.76 times to fouls, and 3.21 times to gender. The contribution to predicting wins/losses of cooperative plays to shooting was 0.97 times higher, that to fouls 1.71 times, and that to gender 3.11. That of fouls was 0.57 times higher than that of shooting, 0.59 times than cooperative plays, and 1.82 times than gender. Gender contributed to the prediction of wins/losses 0.57 times more than shooting, 0.59 times more than cooperative plays, and 0.55 times more than fouls.
Table 6. Comparison of odds ratios among variables
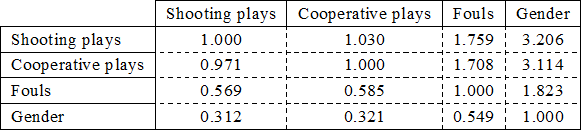
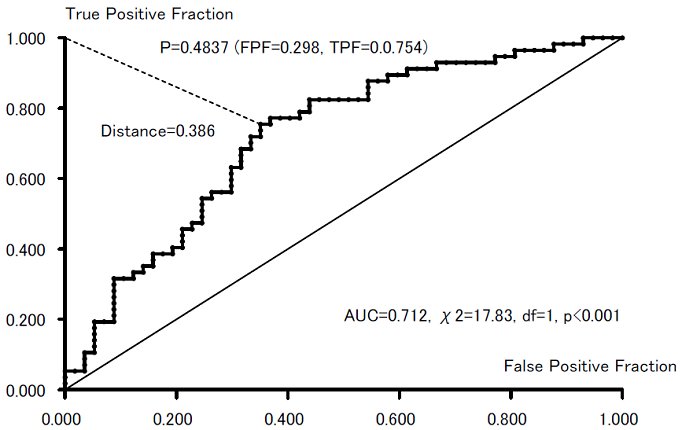
Figure 5 is a ROC (Receiver Operating Characteristic) curve with FPF (False Positive Fraction) as a horizontal axis and with TPF (True Positive Fraction). An oblique line indicates a non-discriminated situation and the further the ROC goes up, the more discrimination increases. The area under the curve is referred to as the AUC (Area Under the Curve) and is 0.712, which is significant (chi-square = 17.83, df=1, and p<0.001) in the statistical test of whether the area under the oblique line is significantly greater than 0.5 or not. In short, the prediction of this model was verified to be effective. When obtaining the probability of the best discriminating cut-off point between wins/losses as the nearest point to the point of the top right-hand corner, it is 0.4837, in which FPF=0.298, TPF=0.754, and distance = 0.386. Based on this cut-off point, a cross table between actual and predicted wins/losses is shown in Table 7.
Table 7. Sensitivity and specificity with the cut-off value =0.4837
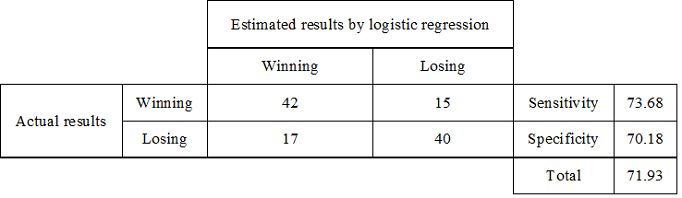
The table shows that sensitivity, which correctly predicted the winning teams, was 73.68% and specificity, which correctly predicted the losing teams, was 70.18%. Again, predictive accuracy was 71.93%.
4. Discussion
4.1 Homogeneity in skills/factors
Although principal component scores were computed in order to obtain highly homogenous skill/factor scores, only “Vertical long passing” did not show a significant principal loading in passing plays. Goto et al. (2000), who examined the relationship between passing and pivot skills, described that the more skillful a player is in pivoting, the more accurate they are in passing. It is thought that “Vertical long passing” did not show a significant association with other passing skills because vertical long passing for one’s own basket did not require the pivot action.
As a characteristic of games involving unskilled players, it is well known that an in-a-pack condition (Dango-jyotai in Japanese) where all the players are concentrated around the ball occurs (Hirose et al., 2012; Nakanishi et al., 2003; Sakakibara, 1994), which is often observed in the shooting scene around the basket. At that time, a player who intends to shoot cannot break through the opponent’s defense because of their underdeveloped dribbling skills and in many cases passes the ball to another teammate in desperation. Since the other player who receives the ball shoots from the spot where they received the ball, shooting after dribbling and lay-up shooting are rarely seen. For this reason, it is thought that vertical long passing is not associated with other passing plays.
Again, the result that “Jumping into a rebound by dodging the opponent” did not show a significant correlation with other rebounding plays can be explained by the very small frequency at which skills like these are performed because they are too high level for beginners. Similarly, it is thought that their lack of skill development hindered the implementation of high-level performance like this is the reason why the skills did not appear prominently in the fast break and cooperative plays. For instance, since an in-a-pack condition (Dango-jyotai in Japanese) where all players are concentrated around the ball often occurs in both offensive and defensive situations, individual skills around the ball were found. Additionally, only a skilled player advances the ball, and few successive offensive plays with two or more players were found.
4.2 Structure of skills/factors
The two-dimensional space obtained comprise the two axes of “Individual skills and skills leading to fouls/violations” and “Individual – group skills,” and the four clusters of “Ball-advancing individual skills;” “Under-basket individual skills;” “Cooperative skills;” and “Against-rule and unskilled plays.” “Ball-advancing individual skills” are ball-handling skills in which both dribbling and passing skills control the ball and have in common the fact that pivoting and other skills are required. At an unskilled stage, a rebound is often gained by a shooter using their own sense of timing. The case where a player other than the shooter gains a rebound is limited to when the ball lands at the spot where the player is standing. For that reason, it is thought that shooting and rebounding are associated with each other. The fact that “Cooperative skills” was composed of only one skill can be explained by the reason that the ball is advanced by a skilled player or around two players to an area under the basket, and elaborate cooperative plays with many players are rarely seen. Finally, the reason that the relationship between the factors of violations/fouls and fast breaks are found in “Against-rule and unskilled plays” can be explained by the following reasons: In the early stage of a fast break, the offensive players easily commit violations such as traveling and line-crossing when they start to dash toward the basket and defensive players easily commit fouls such as slapping the opponent’s hand and body contact in order to prevent the movements of a quick offensive player.
4.3 Influence of plays/factors when considering the relationship of mutual independent variables
The maximum likelihood test chose the model that included “Shooting,” “Cooperative plays,” “Fouls,” and gender. Statistical tests using a correlation ratio that did not take into consideration the mutual relationship among independent variables found that “Dribbling“ was significant, as opposed to “Fouls” which was significant in multivariate analysis, in addition to “Shooting” and “Cooperative plays” that were common in both analyses. It is thought that although “Dribbling” apparently seems to be important on its own, “Cooperative plays” that are close to “Dribbling” in a two-dimensional space required similar skills and compensated for it. Instead, violations such as traveling and crossing the line or fouls such as careless body contact that are caused by their lack of skills are thought to be the decisive factors for wins/losses in games.
4.4 Difference of plays/factors influencing wins/losses involving skilled players
Although it is natural that shooting be considered a decisive factor for wins/losses involving both skilled and unskilled players, many studies have commonly reported that (defensive) rebounding and assist passing are influential factors in game outcomes involving skilled players, no significant relationship was found in this study. It is thought that rebounding is achieved by the shooter in almost all instances involving beginners, and it is too hard to get a rebound shot by another player while synchronizing it for beginners.
5. Conclusion: Proposal for training of unskilled players
First of all, the concentration of both offensive and defensive players around the ball (Dango-jyotai in Japanese) can be cited as a characteristic of plays performed in basketball games involving unskilled players, such as in basketball PE classes. It can be said that this prevents the development of many kinds of basketball skills. Therefore, this is something that is important for both offensive and defensive players to notice. For instance, to prevent the concentration of players around the ball, what should be considered is adopting strategies such as zone defense of the zone or man-to-man defense to defend a specific player. By doing so, it is also envisioned that unnecessary body contact against the opponent could be reduced. To progress to a more advanced level, training that allows students to learn advanced skills using the space on the court produced using these strategies is advised.
Author Contributions
Conceptualization, K.N.,O.A; methodology, K.N., O.A.,A.Y.,I.K.,T.K.,S.T.,T.A.,Y.O; validation, K.N.,A.O.; formal analysis, K.N.,A.O; investigation, K.N, A.O, A.Y; writing—original draft preparation, K.N.; writing—review and editing, A.O.; visualization, A.O.; supervision, K.N., A.O.; project administration, A.O.; funding acquisition, A.O., A.Y.;All authorshave read and agreed to the published version of the manuscript.
Funding
This work was supported in part by funding from Fukuoka University (Grant No. 196008) Grant-in-Aid for Scientific Research (Grant No. 20K11381).
Data Availability Statement
The data in the study are not publicly available in order to protect privacy of the participants.
Informed Consent Statement
Informed consent was obtained from all participants involved in the study.
Conflicts of Interest
The authors declare no conflict of interest.
References
Dillon, W. R. and Goldstein, M. (1984). Multivariate analysis: Methods and application. John Wiley & Sons: New York, pp. 360-393.
Goto, Y.and Iwaki, S. (2006). Aspects of the rebound acquisition in basketball in relation to victory or defeat. Bulletin of Hyogo University of Teaching Education 29:145-157. (in Japanese with an English abstract)
Goto, K., Matsushita, K. and Inoue, N. (2000). Studies on whether or no unskillfulness of pivoting action leads to a poor acquirement of shooting and passing skill in basketball game. Journal of Practical Education, Hyogo University of Teacher Education 14: 53-61. (in Japanese with an English abstract)
Hair, J. F. Jr., Black, W. C., Babin, B. J. and Anderson, R. E. (2010). Multivariate data analysis: A global perspective, 7th Ed., Pearson: Boston, pp. 335-438.
Harman, H. H. (1976). Modern factor analysis, Third Ed., Revised, The University of Chicago Press: Chicago, pp. 290-299.
Hirose, K. and Kurohara, T. (2012). A framework of game understanding in a theory of game structure: From the perspective of the development of goal oriented sports. Pedagogy of Physical Education 60(7): 57-61. (in Japanese)
Kodama, Y., Ohga, Y. and Kimura K. (2010). Score analysis of top 8 teams at Basketball World Championship Games in 2006 (Part 2). Bulletin of Sendai University 41(2): 203-222. (in Japanese with an English abstract)
Kodama, Y. and Suzuki, T. (1990). Multidimensional structure of basketball scores. Japanese Journal of Sport Sciences 9(5): 272-279. (in Japanese)
Koh, K. T., John, W. and Mallett, C. (2011). Discriminating factors between successful and unsuccessful team: a case study in elite youth Olympic basketball games. Journal of quantitative analysis in sports. 7(3): 1-13.
Maeyama, S. (1996). The relation between shoot and assistant pass in basketball game. The Annual Reports of Health, Physical Education and Sport Science. The Annual Reports of Health, Physical Education and Sport Science, Kokushikan University. 15: 27-31. (in Japanese with an English abstract)
Nakanishi, T., Tsuji, H. and Goto, Y. (2003). A method to get rid of the concentration (Dango-jyotai in Japanese) of child players around the ball in basketball games: Without the restriction of moving area. Practical Education Study, Hyogo University of Teacher Education 17: 1-9. (in Japanese)
Ohga K., Asai, T., Suzuki, T and Kodama, Y. (1990). An analysis of the basketball game with the factor analysis. Bulletin of Yamagata University, Education Science. Practical Reports of Education Study, Yamagata University. 10(1): 65-81. (in Japanese with an English abstract)
Oida, K. and Shimada, M. (1969). Game analysis of basketball. Japan Journal of Physical Education 13(5):252. (in Japanese) https://doi.org/10.5432/jjpehss.KJ00003396371
Okamoto, S. (1989). A study on the analysis of basketball games. Bulletin of Education and Research Center, Nara University of Education 38(1): 75-81. (in Japanese with an English abstract) https://doi.org/10.20693/jspeconf.40B.0_709
Ortega, E., Cardenas, D., Baranda, S. and Palao, J. M. (2006). Differences between winning and losing teams in youth basketball games (14 – 16 years old). International Journal of Applied Sports Sciences 18(2): 1-11.
Sakai, K., Daimon, Y., Kobayashi, K. (1998). A basic study based on the structure of team performance in a ball game: In the case of basketball game. Bulletin of Japan Women’s College of Physical Education 28: 18-26. (in Japanese with an English abstract)
Sakakibara, K. (1994). Reconsideration of Dango (Concentration around the ball) soccer in PE classes. School Physical Education 47(1): 80-82. (in Japanese)
Sampaio,J and Sebastina Feu, S. I. (2004). Discriminative power of basketball game-related statistics by level of competition and sex. Perceptual and Motor Skills 99: 1231-1238. http://dx.doi.org/10.2466/pms.99.3f.1231-1238
Seki, S. (1974) Basketball. Seki, S., Nagashima, M., Hatori, Y. and Tochibori, S. (Eds.) Ball games instruction handbook. Taishukan: Tokyo, pp. 35-144. (in Japanese)
Shimada, I. (1992) Strategy and tactics to win basketball games. Taishukan: Tokyo, pp. 7-12. (in Japanese)
Suzuki, T. and Kodama, Y. (1988). Analysis of structural properties on basketball performance: An application of mutidimensional scaling method to score analysis. Tohoku Journal of Physical Education 8(1): 11-24. (in Japanese with an English abstract)
Takane, Y., Young, Y. and de Leeuw, J. (1977). Nonmetric individual differences multidimensional scaling: An alternative least squares method with optimal scaling features. Psychometrika 42: 7-67.
Tamaki, M. (2007). Game analysis in basketball games: The team characteristics and influence to winning/losing from 2point-and 3point shooting perspective. Bulletin of Tokyo Women’s University/Junior College of Physical Education 42:41-45. (in Japanese with an English abstract)
Yaita, A. and Nodera, K. (2007). Effects of shooting percentage on the outcome of basketball games. Bulletin of Sport Science, Kyushu Kyoritsu University 1:17-22. (in Japanese with an English abstract)
Young, F. W. and Torgerson, W. S. (1967). TORSCA: A FORTRAN IV program for Shepard-Kruscal multidimensional scaling analysis. Behavior Science 12: 498.
Relevant Articles
-

Why do you recall that smelly food? Effects of childhood residence region and potential reinforcing effect of marriage
by Yoshinori Miyamura - 2026,2
VIEW -
Exploring Undergraduate Students’ Transformative Learning Experiences through an eHealth Literacy Workshop in Japan
by Takafumi Tomura - 2026,1
VIEW -
An attempt to realize digital transformation in local governments by utilizing the IT skills of information science students
by Edmund Soji Otabe - 2025,4
VIEW -
A practical evaluation method using item response theory to evaluate children’s form of Jumping-over and crawling-under
by Yasufumi Ohyama - 2025,3
VIEW