

Search for Articles
Special Issue Agriculture Electrical and Electronic Engineering Food Sciences Information Sciences
Wildlife Approach Detection Using a Custom-Built Multimodal IoT Camera System with Environmental Sound Analysis
Journal Of Digital Life.2025, 5,S2;
Received:November 22, 2024 Revised:January 18, 2025 Accepted:January 26, 2025 Published:March 26, 2025

- Ryo Tochimoto
- Graduate School of Computer Science, Nihon University
- Katsunori Oyama
- Department of Computer Science, College of Engineering, Nihon University
- Kazuki Nakamura
- Department of Computer Science, College of Engineering, Nihon University
Correspondence: oyama.katsunori@nihon-u.ac.jp
Abstract
This paper presents a custom-built IoT camera system designed for recognizing wild animal approaches, where data transmission and power consumption are critical concerns in resource-constrained outdoor settings. The proposed method involves the spectral analysis on both infrared and environmental sound data before uploading images and videos to the remote server. Experiments, including battery endurance tests and wildlife monitoring, were conducted to validate the system. These results showed that the system minimized false positives caused by environmental factors such as wind or vegetation movement. Importantly, adding frequency features from audio waveforms that capture sounds including wind noise and footsteps led to an improvement in detection accuracy, which increased the AUC from 0.894 to 0.990 in Random Forest (RF) and from 0.900 with infrared sensor data alone to 0.987 in Logistic Regression (LR). These findings contribute to applications in wildlife conservation, agricultural protection, and ecosystem monitoring.
1. Introduction
Crop damage caused by wildlife remains a serious social issue, as it leads to certain vulnerable species becoming un-cultivable (Ministry of Agriculture, Forestry and Fisheries, 2023). Monitoring animal behavior is a critical first step in controlling wildlife pests; however, tracking free-roaming animals such as wild boars within a camera’s field of view is inherently challenging. Fixed cameras equipped with human detection sensors in the real-world outdoor settings often experience false detections due to noise generated by swaying vegetation, resulting in an excessive number of unnecessary images being uploaded to a cloud server. Additionally, battery exhaustion is a persistent issue when installing cameras in remote, mountainous areas where securing a power source is impractical. Even when animals are captured within the camera’s field of view, it is often challenging to interpret situations involving an approaching animal based solely on images. Proper interpretation and appropriate actions require considering the behavioral and environmental contexts with those the detection results (Chang et al., 2009; Wu et al., 2023). Environmental contexts can include various audible events such as footsteps, wind, and vegetation movement. These environmental contexts have the potential to indirectly identify animal presence or movement.
Most wildlife monitoring systems adopt either bioacoustic monitoring or image processing techniques. Bioacoustic monitoring is effective for detecting animals through vocalizations, enabling the monitoring of species such as frogs and deer (McLoughlin et al., 2019; Lostanlen et al., 2019). However, this approach assumes that animals vocalize and that environmental noise is minimal. On the other hand, YOLO (You Only Look Once) models are widely used for their high accuracy and real-time performance in image processing (Li et al., 2023; Ma et al., 2024). Yet, both methods face challenges in terms of energy consumption and data transmission when implemented on resource-constrained devices such as the Raspberry Pi.
Existing wildlife monitoring solutions include commercial trail cameras from SPYPOINT and Moultrie. These products often employ AI-based filters to mitigate false triggers and can upload images via Wi-Fi or cellular networks. However, they primarily rely on PIR sensors and image-based analysis before uploading images, which may lead to increased false positives in windy or densely vegetated environments (SPYPOINT, n.d.; Moultrie Mobile, n.d.). In contrast, our approach integrates both infrared and audio frequency features (e.g., wind noise, footsteps) to reduce false positives more effectively, especially under challenging outdoor conditions.
Our study is among the first to indicate that combining infrared and audio data efficiently improves detection accuracy, which not only conserves energy and reduces data transmission but also extends operational longevity in remote wildlife monitoring applications. We have been developing custom-built IoT camera systems based on Raspberry Pi Zero 2 by integrating infrared and audio sensors for monitoring animal movements (Tochimoto et al., 2023). Unlike existing systems, our multimodal approach uniquely employs spectral analysis on both infrared and environmental sound data collected from the surroundings to minimize false positives caused by environmental factors such as wind or vegetation movement. This study primarily targets medium to large animals, such as wild boars, deer, monkeys, and raccoons, as these species are known to cause significant damage to crops.
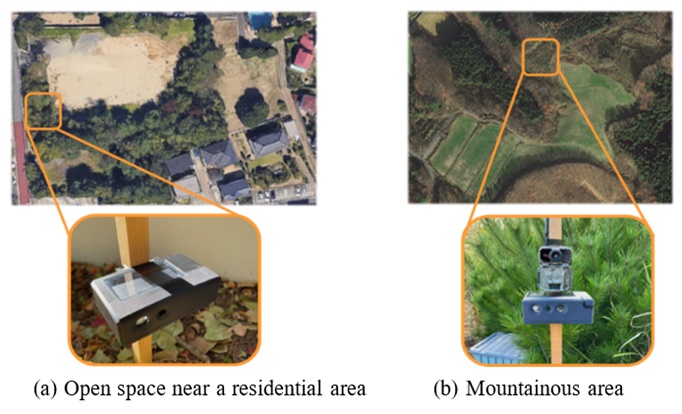
This paper presents the experimental evaluations of our multimodal IoT camera system, conducted at two distinct locations in Japan. In 2023, we tested the system in an open space near a residential area to assess its performance under moderate environmental conditions by focusing on the system’s ability to reduce false detections in a relatively controlled setting. Subsequently, from May to July 2024, we deployed the system in a mountainous region of Katsurao Village, Fukushima, Japan, where the environment introduced challenges such as dense vegetation and variable weather conditions.
2. Multimodal IoT Camera System
2.1. Hardware Design and Implementation
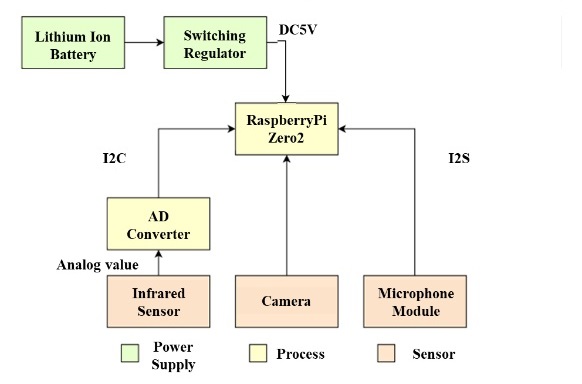
The IoT camera system developed in this study is based on the Raspberry Pi Zero 2 to integrate various sensors such as an infrared sensor, infrared camera, Raspberry Pi camera, and audio microphone. Two types of the multimodal camera systems were designed for this research: The first model, Version 1 (Ver 1), uses a small mobile battery paired with a solar panel, while the second model, Version 2 (Ver 2), employs a 12 V lithium-ion battery to support extended continuous operation. In Ver 1, the system features a solar panel that recharges the battery using sunlight. Ver 2, on the other hand, has a larger battery capacity than Ver 1 and is also equipped with an infrared camera to enable nighttime detection. Both models are housed in custom-designed cases created with a 3D printer, which encase all sensors and batteries. The front of the case includes an infrared sensor, a camera, and an audio microphone. Each case is designed to be highly waterproof, with functionality verified through high-pressure shower tests, as shown in Figure 1.
The infrared sensor used in this study is a pyroelectric infrared sensor, PaPIRs (manufactured by Panasonic, long-distance detection type. This sensor is a long-distance detection type with a 12-m range, providing an analog output that enables the collection of time-series data from the surrounding environment for advanced time-series analysis. Our preliminary tests indicate that beyond 12 m, false alarms rise significantly due to environmental factors, which informed our decision to limit the range for improved accuracy and power conservation (Tochimoto et al., 2023). Detection ranges of commercial trail cameras can exceed 15 m, potentially increasing the risk of false positives in dense vegetation. In contrast, we selected a 12 m effective detection radius to balance sensitivity and battery efficiency.
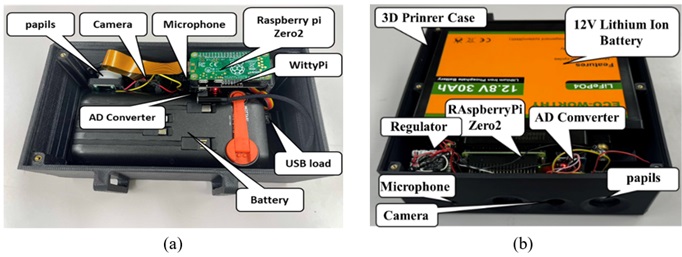
In addition, an omnidirectional audio microphone, as illustrated in Figure 2, captures environmental audio waveforms, including sounds from rain, wind, and animal vocalizations. Processing this time-series audio data allows the system to classify diverse environmental sounds, during interpreting motion detected by the infrared sensor.
2.2. Software Design and Implementation
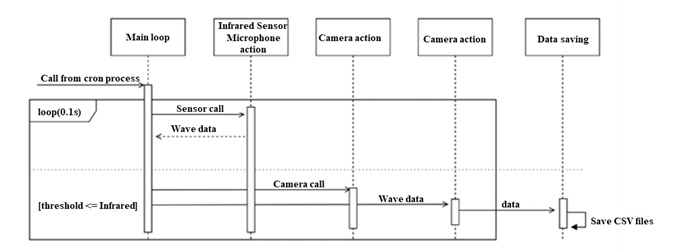
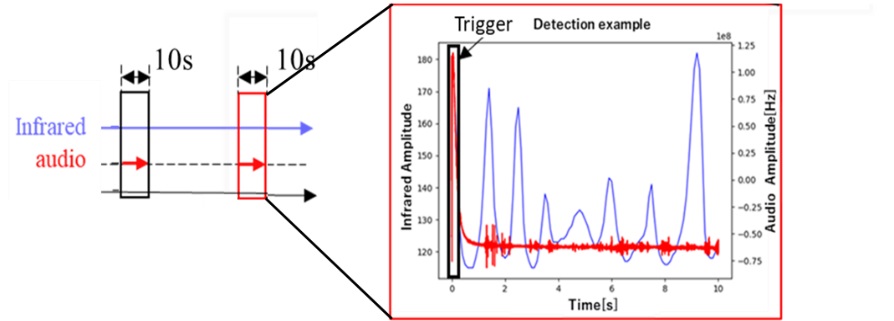
This system requires continuous acquisition of infrared data while simultaneously operating the camera and microphone. Multithreading is employed for enabling the concurrent operation of various sensors. Every 0.1 seconds, the system retrieves values from the infrared sensor. As shown in Figure 3 of the system’s sequence diagram, if a reaction is detected, it initiates both the photo capture and audio recording processes as subprocesses to collect data concurrently, while infrared data collection remains uninterrupted. Additionally, creating a cron job on the Raspberry Pi Zero 2, which is a resident program for executing scripts automatically, enables the device to start sensing immediately upon power-on.
The transmission of image data is the heaviest load on server communication. Therefore, to minimize unnecessary image transmissions and improve efficiency in resource-limited environments, such as mountainous areas, the system uses machine learning models locally to assess the likelihood of animal detection before transmission. Only when there is a high probability of detecting an animal does the system transmit relevant data to the remote server.
3. Methods
3.1. Operation Testing
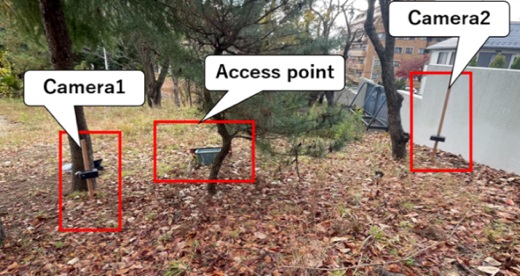
The multimodal IoT camera system continuously monitors infrared waveforms. The system records images, videos, and audio data to log detected events when the detection threshold is exceeded. The collected infrared waveform data is stored in CSV format hourly, and data retrieval is performed remotely via a 4th Generation Mobile Communication System (4G) connection. Figure 4 illustrates the test setup. A power supply with a solar panel and a 4G router is placed at the center, with the Camera 1 and the Camera 2 representing the IoT camera systems developed and installed for this study. Each IoT camera system is connected via Wi-Fi and can be placed anywhere within a Wi-Fi range of approximately 50 m.
3.2. Test Sites and Measured Data
Data collection for this study was conducted at two test sites: (a) an open space near a residential area in April 2023 and (b) a mountainous area in Katsurao Village, Fukushima, Japan, from May to July 2024. Two IoT cameras were installed at each site, with the sensing areas marked as squares in the figures. At both locations, the ground was covered with leaves and grass, and vegetation was within the cameras’ field of view. Conducting experiments at two different locations not only provided diverse measured data for model training and testing but also strengthened the reliability of the findings by validating the system under the practical environmental conditions.
Figure 6 shows an example of the infrared and audio waveform data collected per window time. To prepare the data for analysis, the following processing steps were performed. Noise artifacts may occur depending on the recording’s start time (as shown in Figure 6), and these can affect the Fourier Transform (FFT) results. Therefore, as part of the audio data preprocessing, the first 0.3 seconds from the start of the recording were removed. Additionally, as preprocessing for the infrared data, a 10-second window was extracted from the point of detection. Next, FFT was applied to the time-series data of the infrared and audio waveforms. By converting these waveforms to the frequency domain for each time window, characteristic features were extracted. Subsequently, the sum and variance of the infrared and audio waveform FFT results were calculated, and labels for successful detection (“Approaching”) or failed detection (“No Approaching”) were added based on the footage captured during detection, creating the dataset for analysis.
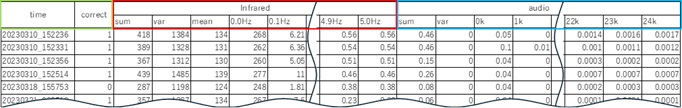
As shown in Table 1, the first set of columns in the dataset includes the filename, which contains the timestamp and the ground truth label. The subsequent columns (highlighted in red and blue) represent frequency features extracted from the infrared and audio waveforms. The column labeled “sum” indicates the sum of the components within the active frequency bands, “var” represents the variance of those components within the 10-second window, and “mean” represents their mean value. The “0.0 Hz” column indicates the spectral power of the frequency band between 0 Hz and 0.1 Hz.
Table 1: Example Dataset with Frequency Features from Infrared and Audio Waveforms
3.3. PCA Method
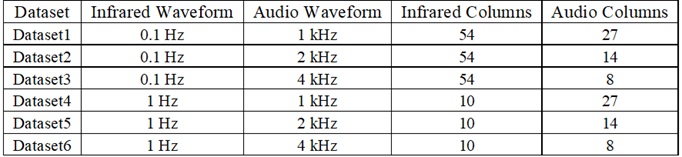
To extract spectral features in the frequency domain, a dataset was generated where the spectral power for each frequency band served as a feature. The infrared waveform was segmented into units of either 0.1 Hz or 1 Hz, while the audio waveform was divided into units of 1 kHz, 2 kHz, and 4 kHz to assess their impact on detection accuracy. This segmentation, however, resulted in high-dimensional data. As illustrated in Table 2, six datasets (Dataset1 through Dataset6) were created based on these configurations. To manage the high dimensionality, Principal Component Analysis (PCA) was employed for dimensionality reduction, and detection accuracy was evaluated both with and without PCA.
Table 2: Column Specifications for Each Dataset Based on Infrared and Audio Waveforms
3.4. Machine Learning Method
Two machine learning models, Random Forest (RF) and Logistic Regression (LR), were evaluated to compare the performance of the system using infrared and audio waveform data. Additionally, two approaches were tested to maximize model accuracy: one applied dimensionality reduction via Principal Component Analysis (PCA) to extract key features, while the other used all features without PCA.
In the PCA-applied approach, the reduced-dimension data were input into the model. In contrast, in the non-PCA approach, all features were used directly without dimensionality reduction. This comparison aimed to evaluate improvements in training efficiency achieved through dimensionality reduction and to analyze performance differences between models using all features and those using reduced features.
To address class imbalances in the training data, the Synthetic Minority Over-sampling Technique (SMOTE) was applied, and a stratified 5-fold cross-validation was performed. This approach enables a balanced training dataset by reducing the effects of class imbalance during training. The test data were used without additional processing, and model performance was assessed using the Area Under the Curve (AUC) metric.
4. Results
4.1. Operation Verification Results
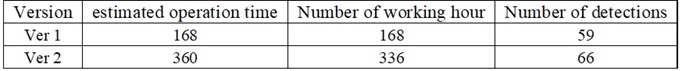
Table 3 shows the predicted and actual operating days of the system. In this experiment, two types of systems were tested: The Ver 1 as the mobile battery model and the Ver 2 as the lithium-ion battery model, with the operating time of each system measured.
In the Ver 1, power consumption was approximately 1 W, with a battery capacity of 144 Wh. Although the predicted operating time was 144 hours, the result showed the system operated continuously for 168 hours, which is likely extended by the solar panel recharging the battery. In the Ver 2, with a battery capacity of 360 Wh (12 V) and a power consumption of 1 W, the estimated operating time was 360 hours. The actual operating time was 336 hours, approximately two weeks, and was close to the expected result. Both models demonstrated that power consumption and environmental conditions influenced operating time, with the Ver 2 proving more suitable for stable, long-term operation.
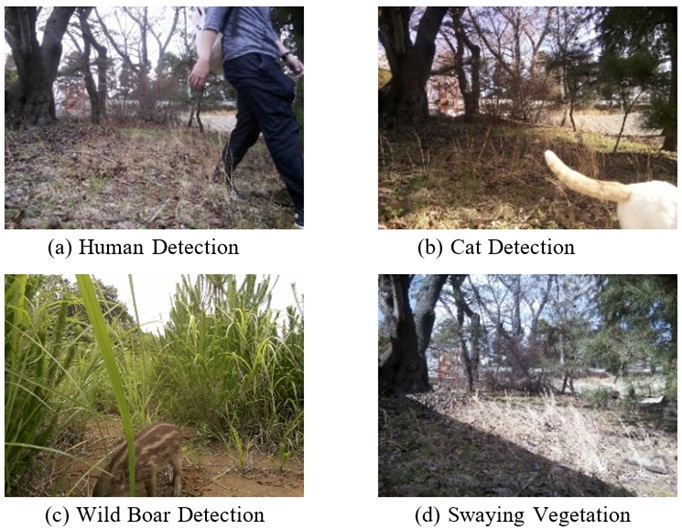
Table 3: Operational Records and Detection Counts
4.2. Data Collection Results
At the first test site, 267 data instances were collected, including 13 instances with animals and 254 without. At the second test site in Katsurao Village, 2,087 data instances were collected, with 109 containing animals and 1,978 without. The images shown in Figure 7 below provide examples of actual camera captures. At the first site, data included images of humans and cats, while at the second test site, images included humans, dogs, raccoons, and wild boars. When no animals were present, the cameras occasionally recorded empty scenes triggered mistakenly by swaying vegetation due to wind.
4.3. PCA Results
To improve the performance of the machine learning model, feature selection was conducted to identify the most relevant columns (features). Given the high dimensionality of the current dataset, a Principal Component Analysis (PCA) was applied to reduce dimensionality and extract the most important features. For each dataset, principal components were selected until the cumulative contribution rate reached 90%, and the contribution of each feature to these components was evaluated. Figure 8 shows the cumulative contribution rates of PCA for each dataset, while Table 4 lists the top 10 contributing features in Principal Components 1 (PC1) to 5 (PC5) for each dataset. Based on the analysis of the contributing features and the video data, the PC1 likely corresponds to swaying vegetation, and the PC2 to environmental noise such as wind.
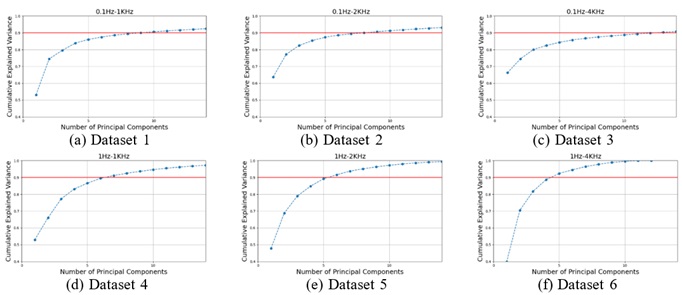
Table 4: Contribution Rate (Example from Dataset1)
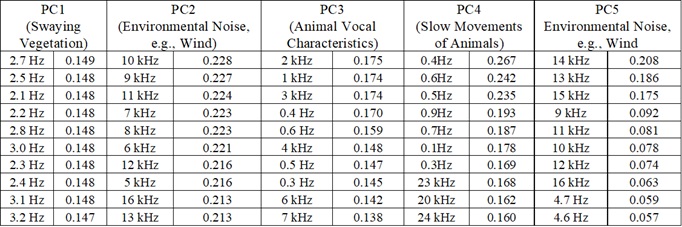
For the infrared waveform, low-frequency components such as 2–3 Hz and 0.1–1 Hz made substantial contributions across multiple datasets, as they appear to reflect responses to animal approaches and environmental fluctuations. In the audio waveform, high and mid-frequency components, specifically in the 10–11 kHz and 1–3 kHz ranges, were also significant, and may correspond to noise and animal-related sounds in the audio signal. The variance of the audio waveform (“var” in the audio category, as shown in Table 1) contributed strongly across multiple datasets as a key indicator of variations in environmental and animal sounds.
4.4. Machine Learning Results
Table 5 shows the 5-fold stratified cross-validated AUC scores and the independent test AUC scores of the RF model with and without PCA. These cross-validated AUC scores are averaged over a stratified 5-fold procedure with SMOTE applied to the training split (80 %), while the test AUC scores represent performance on a separate hold-out set (20 %) without further oversampling. From the results, the combination of infrared 0.1 Hz and audio 4 kHz achieved the highest AUC score of 0.990. When PCA was applied, the combination of infrared 0.1 Hz and audio 1 kHz recorded a high AUC score of 0.986. These results indicate that for lower-dimensional data, high performance can be achieved even without using PCA.
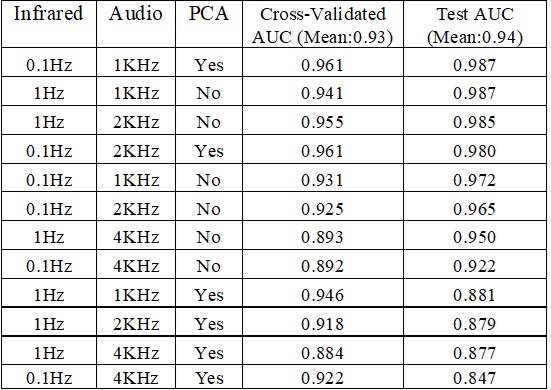
Table 6 presents the AUC results of the LR model with and without PCA. When PCA was applied, the combination of infrared 0.1 Hz and audio 1 kHz achieved an AUC of 0.987 with PCA, which nearly matched the 0.985 AUC without PCA. This finding indicates a slight improvement in model accuracy when PCA is applied to higher-dimensional data.
The Random Forest (RF) model maintained high performance regardless of whether PCA was applied or not. It is noteworthy that the combination of infrared 0.1 Hz and audio 4 kHz achieved the highest AUC score of 0.990 without PCA. Furthermore, even with PCA applied, high AUC scores of 0.986 were recorded for the combinations of infrared 0.1 Hz and audio 1 kHz, as well as infrared 0.1 Hz and audio 2 kHz. These results indicate that the RF model can achieve sufficient performance without PCA, while PCA proves to be effective for high-dimensional data.
On the other hand, applying PCA to low-dimensional data was found to reduce performance. For instance, in the Logistic Regression (LR) model, the combination of infrared 1 Hz and audio 4 kHz achieved an AUC score of 0.950 without PCA, which dropped to 0.877 when PCA was applied. This demonstrates that PCA is not always effective in every scenario.
Table 5: Random Forest AUC with and without PCA
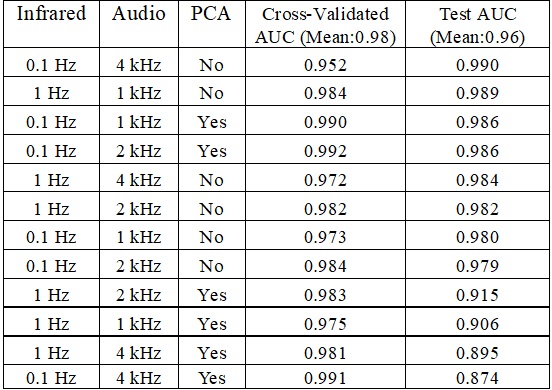
Table 6: Logistic Regression AUC with and without PCA
4.5. Variable Importance in Machine Learning Models
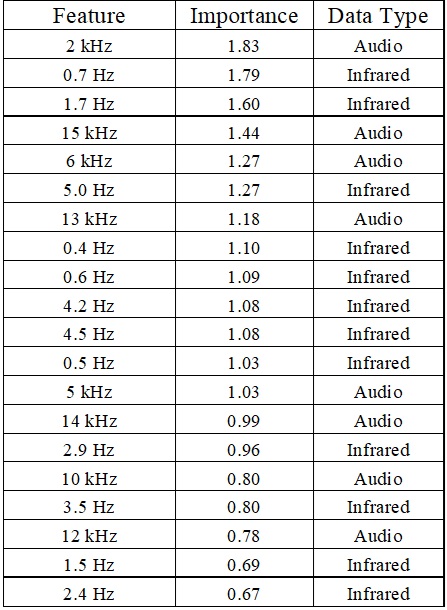
The important frequency bands were identified using the Random Forest (RF) and Logistic Regression (LR). As shown in Tables 7 and 8, the analysis focused on the data with the highest AUC values among those without PCA, specifically the combination of infrared 0.1 Hz and audio 1 kHz, to identify key frequency bands. Table 7 summarizes the feature importance from the RF, while Table 8 shows the coefficients from the LR.
In the RF results, the 5 kHz frequency band showed the highest importance (0.079), followed by 11 kHz, 13 kHz, and 10 kHz. These results indicate that high-frequency audio data plays a significant role in animal detection. In contrast, the importance of infrared data was relatively low, and high-frequency audio data contributes substantially to the model’s predictions.
The RF model prioritized high-frequency audio bands (e.g., 5 kHz, 11 kHz, 13 kHz), and it suggests that audio data plays an important role in detecting animal vocalizations and environmental noise. The LR model, however, placed greater emphasis on low-frequency infrared data, such as 0.7 Hz and 1.7 Hz. This suggests that infrared data is more effective for identifying slow animal movements and environmental fluctuations.
Table 7: Random Forest Feature Importance
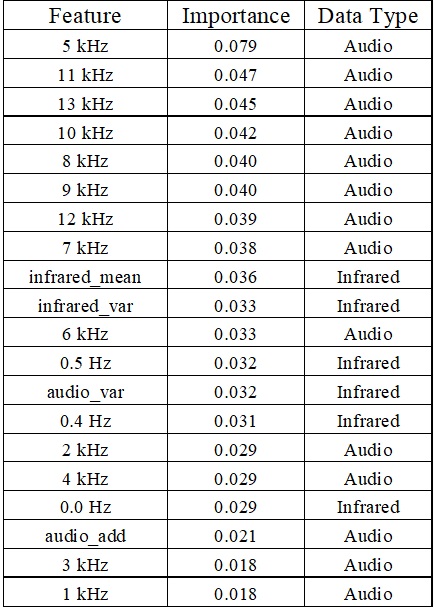
Table8: Logistic Regression Coefficients
4.6. Influence of Audio Waveform
This study assessed the effect of integrating audio waveforms with infrared waveforms on the accuracy of animal approach detection. Models trained with only infrared waveforms were compared to those using both infrared and audio waveforms. As shown in Figure 9, AUC scores for the RF and the LR achieved 0.894 and 0.900, respectively, when using only infrared waveforms. These models using frequency features extracted from infrared waveforms alone achieved a reasonable level of accuracy, although the risk of false positives and missed detections remains. The inclusion of audio frequency features improved the AUC to 0.990 for the RF and 0.987 for the LR. These results are consistent with the cross-validated and test AUC values shown in Tables 5 and 6. From these findings, we confirm that integrating audio waveforms plays an essential role.
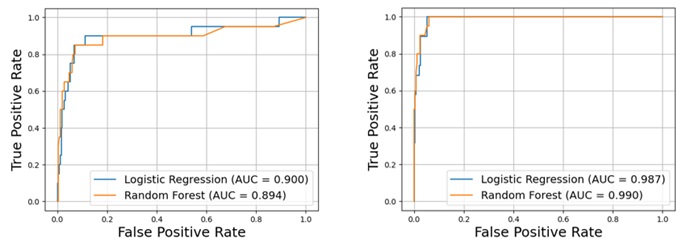
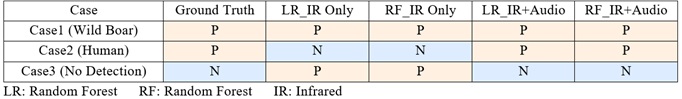
Table 9 summarizes selected training results for each model, while Figure 10 illustrates examples of detection under different conditions: Case 1 (Wild Boar) represents a straightforward scenario where accurate detection was achieved with both infrared-only and infrared-plus-audio data. Case 2 (Human) is the case of a false negative in the infrared-only approach, where minimal movement between frames caused the model to misclassify the instance as “no approaching.” The addition of frequency features extracted from audio waveforms allowed the detection of human voices, resulting in a correct classification of “approaching.” Lastly, Case 3 (No Detection) is the case of a false positive with the infrared-only approach, where swaying vegetation was misclassified as “approaching.” The addition of frequency features from audio waveforms helped identify wind noise for the correct classification of “no approaching.”
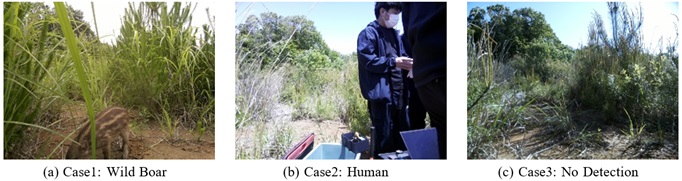
Table 9: Comparison of Detection Results: Infrared Only vs. Infrared with Audio
5. Discussion
This study proposed a multimodal detection system that integrates frequency features from infrared and audio waveforms. The analysis confirmed that frequency bands identified through FFT analysis are important for identifying animal movements and mitigating false detections. Infrared waveforms provided low-frequency components, such as 2–3 Hz (swaying vegetation) and 0.1–1 Hz (slow movements of animals or humans), which were particularly significant, as highlighted in Section 4.5.
Similarly, audio waveforms contributed mid-to-high frequency bands, such as 1–3 kHz (human voices or animal vocalizations) and 10–11 kHz (environmental noise like wind). These features, as demonstrated in Section 4.6, significantly improved the AUC for both the RF and LR models. The integration of audio data effectively reduced errors caused by environmental factors, such as vegetation sway.
Experiments in this study were conducted at two distinct test sites: a residential area and a mountainous region. These environments invited unique challenges such as varying vegetation density and weather conditions for validating the robustness and adaptability of the proposed system. By effectively reducing false detections through the integration of infrared and audio data, the proposed system shows considerable promise for real-world applications.
In this paper, we evaluated both Random Forest (RF)—a non-linear ensemble method—and Logistic Regression (LR)—a linear model—to compare their performance in our system. Based on the analysis in Section 4.4, RF consistently delivers robust, high performance on multimodal (infrared + audio) and higher-dimensional datasets across diverse frequency-segmentation settings. Meanwhile, LR can perform nearly as well, particularly when paired with effective PCA for high-dimensional data, though it is more sensitive to feature engineering. Accordingly, we recommend RF as an immediate, stable solution, whereas LR (and other linear models) may be preferable in scenarios where interpretability is a priority, especially when identifying which features contribute most to the detection results.
Nevertheless, this study has certain limitations. The system relies on camera-based data collection for ground truth labels, limiting detection to the camera’s field of view and introducing a risk of missed detections outside this range. Additionally, as noted in Section 3.1, the Raspberry Pi hardware brought challenges in power consumption, constraining operational time even with a larger battery. Overcoming these challenges will be essential for improving the system’s practicality and enabling its deployment in diverse real-world scenarios.
6. Conclusion and Future Challenges
This study proposed and evaluated a multimodal detection system that integrates frequency features from infrared and audio waveforms to improve the accuracy of animal approach detection. By applying FFT to these waveform types, the system identified critical frequency bands that contribute to the detection accuracy. Infrared waveforms captured low-frequency components, such as 0.1–1 Hz and 2–3 Hz, linked to animal movements and environmental fluctuations. Audio waveforms provided mid-to-high frequency features, such as 1–3 kHz and 10–11 kHz, capturing animal vocalizations, footsteps, and environmental noise. This integration proved highly effective by improving the AUC for RF and LR models to 0.990 and 0.987, respectively. From these results, we confirm that combining infrared and audio data is the key strategy for practical application of the multimodal IoT camera systems.
Future efforts should focus on improvement of robustness and reliability by adapting the system to diverse environmental conditions. Expanding the dataset to include more balanced samples representing various animal species is necessary for refining detection performance. Additionally, optimizing machine learning models for real-time processing and addressing energy efficiency will enable long-term deployment in resource-constrained outdoor environments. By addressing these challenges, the proposed system has the potential to significantly advance wildlife management, mitigate crop damage, and contribute to broader environmental conservation efforts.
Author Contributions
Conceptualization, K.O., and K.N.; methodology, K.O.; software, R.T.; validation, R.T., K.O., and K.O.; formal analysis, R.T.; investigation, R.T. and K.O.; data curation, R.T.; writing—original draft preparation, R.T.; writing—review and editing, K.O.; visualization, R.T.; supervision, K.O.; project administration, K.O. and K.N.
Conflicts of Interest
The authors declare no conflict of interest.
Acknowledgements
We gratefully acknowledge the Fukushima Innovation Coast Framework Promotion Project, which provided a strong foundation for collaboration and innovation in developing the IoT camera systems used in this research.
References:
Chang, C. K., Jiang, H., Ming, H., & Oyama, K. (2009). Situ: A situation-theoretic approach to context-aware service evolution. IEEE Transactions on Services Computing, 2(3), 261–275. https://doi.org/10.1109/TSC.2009.21
Li, S., Zhang, H., & Xu, F. (2023). Intelligent detection method for wildlife based on deep learning. Sensors, 23(19), 9669. https://doi.org/10.3390/s23249669
Lostanlen, V., Salamon, J., Farnsworth, A., Kelling, S., & Bello, J. P. (2019). Robust sound event detection in bioacoustic sensor networks. PLOS ONE, 14(10), e0214168. https://doi.org/10.1371/journal.pone.0214168
Ma, Z., Dong, Y., Xia, Y., Xu, D., Xu, F., & Chen, F. (2024). Wildlife real-time detection in complex forest scenes based on YOLOv5s deep learning network. Remote Sensing, 16(8), 1350. https://doi.org/10.3390/rs16081350
McLoughlin, M. P., Stewart, R., & McElligott, A. G. (2019). Automated bioacoustics: Methods in ecology and conservation and their potential for animal welfare monitoring. Journal of the Royal Society Interface, 16(150), 20190225. https://doi.org/10.1098/rsif.2019.0225
Ministry of Agriculture, Forestry and Fisheries. Summary of the Annual Report on Food, Agriculture and Rural Areas in Japan (FY2023).
https://www.maff.go.jp/e/data/publish/Annual_Report/AnnualReportonFoodAgricultureandRuralAreas_FY2023.pdf
Moultrie Mobile. (n.d.). Why am I getting so many pictures or pictures with nothing in them? https://support.moultriemobile.com/hc/en-us/articles/1500006416442-Why-am-I-getting-so-many-pictures-or-pictures-with-nothing-in-them
SPYPOINT. (n.d.). Best practices for resolving false triggers. https://spypoint.onsitesupport.io/knowledge-base/article/best-practices-for-resolving-false-triggers
Tochimoto, R., Oyama, K., & Ming, H. (2023). Development of an IoT camera system for situation recognition of approaching animals. In Proceedings of the IEEE International Conference on Software Services Engineering (SSE) (pp. 1–6). https://doi.org/10.1109/SSE60056.2023.00047
Wu, J., Feng, Y., & Chang, C. K. (2023). Sound of daily living identification based on hierarchical situation audition. Sensors, 23(7), 3726. https://doi.org/10.3390/s23073726
Relevant Articles
-

Pilot study on changes in frontal oxygenated hemoglobin levels in beginners during practice of Karate Forms
by Kiyohisa Natsume - 2026,3
VIEW -
Why do you recall that smelly food? Effects of childhood residence region and potential reinforcing effect of marriage
by Yoshinori Miyamura - 2026,2
VIEW -
Accuracy of peripheral oxygen saturation (SpO₂) at rest determined by a smart ring: A Study in Controlled Hypoxic Environments
by Yohei Takai - 2025,6
VIEW -
A Study on the Effectiveness of Glycerophosphocholine (α-GPC) as an e-Sports Supplement
by Yuki Kamioka - 2025,5
VIEW