

Search for Articles
Ranking performance and network structure in world rugby sevens; 2011-2020 longitudinal data analysis
Journal Of Digital Life.2022, 2,5;
Received:February 8, 2022 Revised:March 7, 2022 Accepted:March 9, 2022 Published:March 17, 2022

- Koh Sasaki
- Research center for health, physical fitness and sports, Nagoya University
- Mitsuyuki Nakayama
- National Team & High-Performance Division, Japanese Rugby Football Union
- Kensuke Iwabuch
- National Team & High-Performance Division, Japanese Rugby Football Union
- Takumi Yamamoto
- Department of Physical Education, National Defence Academy
- Ichiro Watanabe
- Faculty of Liberal Art, Tokyo City University
- Hironobu Shimozono
- Faculty of Sports and Health Science, Fukuoka University
- Jun Murakami
- Faculty of Sports and Health Science, Fukuoka University
- Takashi Katsuta
- High Performance sport center, Japan Sport Council
- Ichiro Kono
- Graduate School of Comprehensive Human Sciences, Tsukuba University
Correspondence: sasakikoh@htc.nagoya-u.ac.jp
Abstract
The aim of this study was to clarify the attack-defence performances of rugby sevens in 2010-2020 seasons, 4,074 matches. Firstly, averaged try scoring rate and try conceding rate of every teams were drawn in two-dimensions space. Hypothesis 1 was that the achievement values of the upper teams could be clarified. Receiver-Operator-Curve analysis was used to understand how attack-defence indicators correctly diagnose the world rankings. Secondly, the 22m entry attack-defence indicators were drawn in two-dimensional space. Clustering analysis of ranking teams was executed using try scoring rate, try conceding rate, 22m attack-defence indicators. Hypothesis 2 was that the clustering characteristics of upper teams can be clarified by these indexes. Thirdly, network analysis was executed to clarify what kind of characteristic in relationship among the ranking, team performance, and individual performance. The ROC analysis showed the specific achievement level of the top-ranking teams with high accuracy (hypothesis 1). Cluster analysis extracted 4 groups. The gradual attack defence standard values were obtained (hypothesis 2). Network analysis showed the relationship structure among the ranking, the team performance, and the individual performance with some interesting results concerned the dependence tendency changing on the ranking stage (hypothesis 3).
1. Introduction
Rugby sevens was developed in the 1880s as an event to save the financial difficulties of the Melrose Club in Scotland. In 1926, England’s major tournament, Middlesex Sevens was founded as a fundraiser for charity, raising £1,600 for King Edward VII’s Hospital. The first international competition took place in 1973 at Murrayfield Stadium as part of the Scottish Rugby Union’s 100th Anniversary event.
The World Rugby Sevens Series was established in 1999, and the World Rugby Women’s Sevens Series was held in 2012. In 2016, rugby sevens was launched for the first time at the Summer Olympics. The deciding factor for the Olympics would be that it is possible to compete on dynamic game aspects in a short time of 14 minutes in total of the first and second half. As a result, the World Circuit hosts more than 400 games annually around the world.
Rugby sevens analysis has been developed since 2000 and has provided a variety of performance indicators (ball in play, territory, possession, own restarts won, number of Rucks/mauls, number of offloads etc.) (Hughes & Jones, 2005). Higham et al discussed the relationship of the Scoring points and winning the game (Higham et al., 2014). They showed that successful international rugby sevens teams tend to maintain ball possession; more frequently avoid taking the ball into contact; concede fewer turnovers, penalties and free kicks; retain possession in scrums, rucks and mauls. Study about the time control has focused primarily on ball in-play time (Furukawa et al., 2012; Carreras et al., 2013; Ross et al., 2014). In addition, World Rugby has provided a lot of statistical data concerned with the try acquisition time in recent years (World Rugby, 2021a; World Rugby, 2021b).
We have focused the defence performance of rugby union playing by 15-men in each side (Sasaki et al., 2013b; Sasaki et al., 2017a; Sasaki et al., 2021). Especially in close competitions such as international test match or Rugby World Cup final stage, a defence performance like turn-over contributed to win. Is such result different from rugby sevens, where the frequency of attacks would increase because there are more one-on-one spaces and opportunities than 15-side rugby union? Are there any relationships between defensive performances and attacking performances? We had also clarified the central players’ role and tactics which contribute to attack and defence as a network system. What are the tactical characteristics of the rugby sevens?
Network analysis is one method for understanding the cooperative structure among the factors of various organization. This approach has been widely used in many practical science areas to understanding human behavior and tactics. This data mining technique has been started in the field of communication network studies (Inoue et al., 2012; Junker & Shreiber, 2008). Some traditional approaches focusing on network relationships were introduced from 1960 to 1970, including the “small world phenomenon”, “the strength of weak ties”, and “scale free network”. Sociological predictive models are modified in the field of information technology (Newell & Timmons, 2016) and cerebral functions in biology (Junker & Shreiber, 2008; Sanz-Leon et al., 2015; Suzuki, 2017). Network analysis has also been applied in socio-psychological and biological approaches in sport sciences (Shalley & Perry-Smith, 2008; Sasaki et al., 2013a; Pereira et al., 2015; Hambrick, 2019; Putnam, 2001; Sasaki et al., 2017b; Sasaki et al., 2020).
Network analysis would identify the decisive and practical core structures across complex networks. It helps to understand the driving force of network dynamism (Yamamoto & Yokoyama, 2011; Ramos et al., 2018; Kojaku & Matsuda, 2018; Nordlund, 2018). The terminated goal of this study is to clarify the temporal and bipartite or multi-layered structures of rugby sevens using the longitudinal data.
2. Methods
As of February 2021, data more than 10 years have been accumulated by World Rugby (International Federation). We used the open data of 4,074 matches in total for the 2011-2020 World Sevens Series (World Rugby, 2021a). Current study was to elucidate the play characteristics, especially the time structure of rugby sevens international match in last 10 years longitudinal data.
Firstly, averaged the try scoring rate (the time it took own try score) and the try conceding rate (the time it took oppose try score) of every ranking teams on longitudinal year of 2011-2020 were drawn in two dimensions space. Hypothesis 1 was that the specific achievement value of the upper teams could be clarified in this space. This relationship structure would take an exponential change. Linear regression was unrealistic because it leaded to zero cuts. The reality would be curve fitting with no zero cuts (try scoring in 0 seconds). The ranking reference point by the attack and defence performance were calculated on this graph space. Receiver-Operator-Curve (ROC) analysis was used to understand how attack and defence indicators correctly diagnose the world rankings of rugby sevens (cumulative rankings). This method (Akoberg, 2007; Duch et al., 2010; Sasaki et al., 2017a; Sasaki et al., 2021) clarified whether the try scoring rate and try conceding rate diagnose the concrete values of those ranking place or not (1 or 0).
Secondly, the oppose 22-m (about a quarter area of pitch close to opponent’s goal line) entry score rate and the own 22-m (about a quarter area of pitch close to own goal line) entry score rate were drawn in the two-dimensional space. Since these indicators had been introduced from 2015, the data were extracted in 2015-2020. These would mean as the 22-m attack and defence indicators. The 22-m attack indicator obtained by multiplying “the number of own entries into oppose 22m area” by “own scoring rate from there (%)”, and 22m defence indicator obtained by multiplying “the number of oppose entries into own 22m area” by “oppose scoring rate from there (%)”. These were presented by World Rugby (World Rugby, 2021a). However, in this study, placing those in a two-dimensional space was a unique approach. Exponential changes were expected there as well. Clustering analysis of the ranking teams was executed using try scoring rate and try conceding rate obtained in the first stage analysis and the 22-m attack and defence indicators obtained in the second stage analysis. Hypothesis 2 was that the clustering characteristics of the upper teams can be clarified by these indexes.
Thirdly, more detailed longitudinal data for each team were extracted from another Sevens series 2000₋2020 data reported by World Rugby (World Rugby, 2021b). Network analysis could clarify what kind of characteristic in relationship structures between the cumulative team ranking and the team performance (team-score, team-try-score, individual-try-score, individual-clean-breaks and total individual-runs). Fruchterman–Reingold algorithm is a force-directed layout algorithm (Fruchterman & Reingold, 1991). The goal was to position the vertices of the graph in a two- or three-dimensional space so that all edges were of approximately equal length and the number of crossing edges was minimized (Eades, 1984; Inoue ey al., 2012; Kamada & Kawai, 1989; Gajdos et al., 2016). A force-directed algorithm achieves this by assigning forces to the set of vertexes and the set of edges. The forces applied to the vertices pull them closer together or push them further apart.
From the adjacency matrix (ranking teams in rows, performance in columns), the repulsive force (Fr) and attractive forces (Fa) those affect vertices are calculated. Based on those values, the vertices are moved and drawn within the specified area.
Fa(d)=d2/k, Fr(d)=-k2/d,
(d; distance between vertices, k; ideal distance between vertices, area; drawing area, |v|; number of vertices, c; certain constant)
This procedure was iterated until the system reached an equilibrium state. Hypothesis 3 was that this method can clarify the performance characteristics of the top teams in particular. Since these approaches were secondary data analyses of the provided materials, there was the limitation to use more detailed performance engagement structure.
3. Results
Table 1 showed the longitudinal shape of rugby sevens in 2011-2020 including 2016 Rio Olympic summer game and the average value. No significant changes have been seen in any of the indicators, but World Rugby reported that the scoring points had a little decrease from 2011 to 2015, and had recovered to 2020 (World Rugby, 2021a). The time to scoring a try had decreased slightly. The 22-m scoring rate (%) had been increased slightly.
Table 1. The shape of the rugby sevens world series game in 2011-2020 (including 2016 Olympic game)
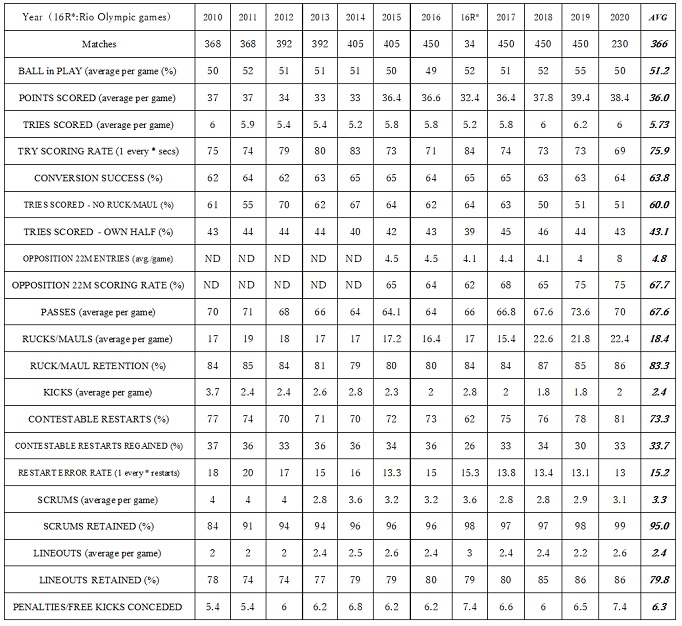
Figure 1 showed the two-dimensional spaces of the try scoring and conceding time. The lower left side of the figure summarized the total for 10 years. On the above and lower left side of the figure 1, the vertical axis showed the attack performance (the lower the direction, the higher the attack efficiency), and the horizontal axis showed the defence performance (the right direction, the higher the defence efficiency). Those could mean the lower right direction showed comparatively good performance.
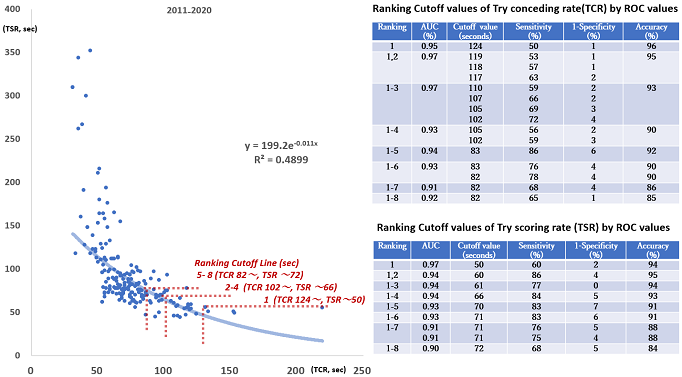
The exponential functions were not large, but it could be seen that the difference in defence ability tended to determine the upper rankings. For reference, the R-squared values were shown in all figures. It could be considered that the closer the R-squared values are to 1, the better the fit to the existing data (Patel et al., 2020).
To test the precision of sensitivity and specificity of this try scoring and conceding rate, we analyzed the Area Under the Curve (AUC) of ROC (Akoberg, 2007; Duch et al., 2010; Sasaki et al., 2017a; Sasaki et al., 2021). The highest AUC scores were obtained with each cut-off values of rugby sevens world ranking. “Sensitivity” showed the rate to evaluate the positive thing correctly (Sasaki et al., 2017a; Sasaki et al., 2021) and the true positive rate were more than 50 %. “1-specificity” showed the rate to evaluate falsely the negative thing as positive (Sasaki et al., 2017a; Sasaki et al., 2021) and the false positive rate (the smaller the better) were less than 7 %. In each ranking value, “Accuracy” was obtained more than 84 %. The AUC values were extremely high at 90% or more, and it could be said to reflects accurately the ranking of 1st to 8th place.
Try scoring rate (time) of 1st place of ranking was within 50 seconds, 2nd ~ 4th was within 66 seconds, and 5th ~ 8th was within 72 seconds in calculated cutoff values by ROC. Try conceding rate of 1st place of ranking was 124 seconds or more, 2nd ~ 4th was 102 seconds or more, 5th ~ 8th was 82 seconds or more. Attacking and defencing time baselines for try were shown as the gradual structure in the graph (red dot line in Figure 1).
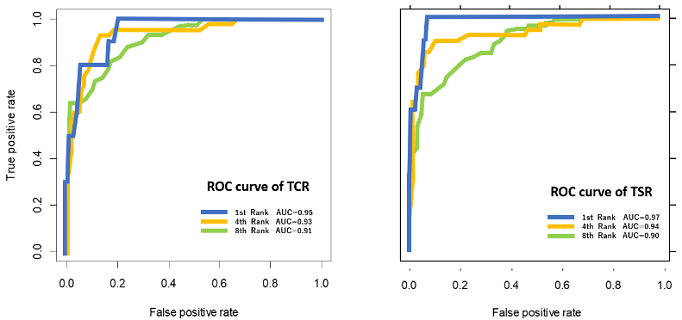
Figure 2 showed ROC curves of the 1st, 4th, and 8th ranking. We performed all ROC analyses with the 1st ~ 8th place, and shown here only of the 1st, 4th and 8th place because those could be raised as almost reference values. Every curve showed high values close to maximum values. The gradual structure of the 1st, 4th, and 8th could be seen. In each curve, the value closest to the upper left vertex was regarded as the cut-off value that meant the specific reference point (seconds) described above.
Figure 3 showed the two-dimensional spaces of the 22m attack and defence indicators. The left side of Fig 3 summarized the total for 6 years (2015-2020). The vertical axis showed the attack performance (the lower the direction, the higher the attack efficiency), and the horizontal axis showed the defence performance (the right direction, the higher the defence efficiency). Those could mean the lower right direction showed good performance. The exponential functions were not large. Compared to the previous Figure 1, the scattering of Figure 3 might be clear and the interpretation of clustering might be easy to obtain.
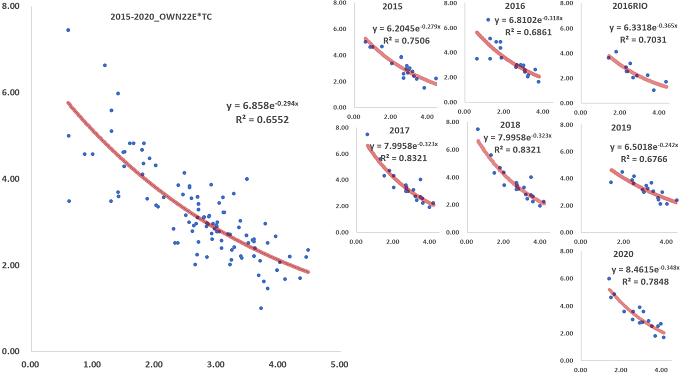
Figure 4 showed the result of k-means clustering. Four clusters by 10,000 times iterations were calculated. Four indicators of TSR, TCR, 22A, and 22D were used for clustering. The top 8 ranks were clearly classified in the rankings, but the under the 9th place, clustering was mixed on the boundary line. It could be interpreted to be clustered almost for the ranking. In particular, the top three teams showed “the 22m attack performance” and “high defence performance”.
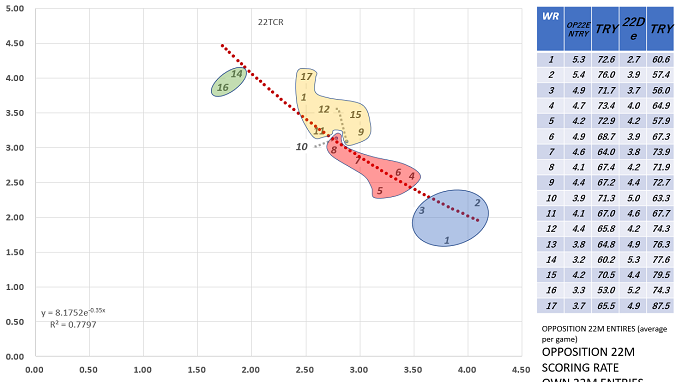
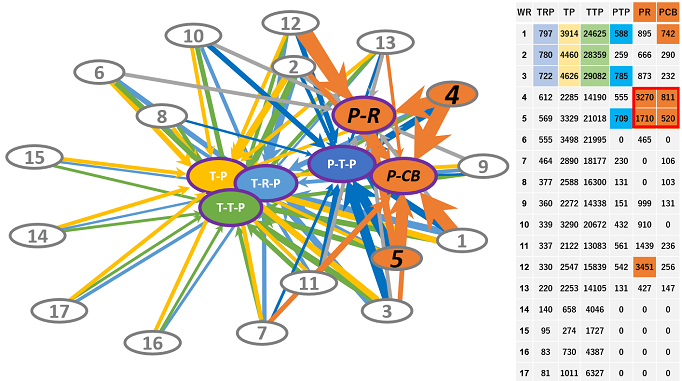
Figure 5 showed the relationship structure among the ranking points, the team performances, and the individual performance in a network space. It drew by Fruchterman–Reingold algorithm, a force-directed layout algorithm, in which the ones which function centrally in the ranking teams were positioned in the centered area. The team / individual performances were positioned at the center area. These were the evidences in the table on the right side in the Figure 4. However, the individual performances of the 4th and 5th place teams outnumbered the 1st ~ 3rd place teams (the orange circles on the right side of Figure 5). The strength of connectivity within these networks (the 4th and 5th to the individual performances) was very large value compared to the strength of the other connectivity. In the Figure 5, the width of the arrow indicated the degree of coupling to each standardized indicator.
4. Discussion
The Ball in play in rugby sevens has tended to remain high at almost 50% (Furukawa et al., 2012; Carreras et al., 2013; Ross et al., 2014). Therefore, the current study focused on the try acquisition time, which would be directly related to the win or loss structure, as a time concerned indicator. In the period of 2011-2020, the recovery after the try score had a little dropped once might be related to the shortened try acquisition time. It was an interesting issue to see how the defence performance of a team with high attack ability was going to be.
4.1. ROC analysis
As the first place of world ranking reference by ROC analysis, it was indicated that the defence performance putting up more than 124 seconds of oppose’ try conceding rate (TCR) and the attacking ability scoring a try within 50 seconds in own try scoring rate (TSR). These values would be positioned as the achievement points in the game which competes for the top in the world rugby sevens by the longitudinal evidence of the past ten years. In the 2nd to 4th place of the rankings, the TCR was 102 seconds or more and TSR was within 66 seconds. And in the 5th to 8th places, the TCR was 82 seconds or more and TSR was within 70 seconds. These may be regarded as the target values of the team aiming at the higher order of ranking. The range from 1st to 8th in the TSR was 20 seconds (50 ~ 70 seconds), while the range of TCR was 42 seconds or more (82 ~ 124 seconds), which was twice. This might suggest that the ups and downs of the latter, defence performance, have a greater effect on the ranking. As the AUC value exceeds 0.5, the data would be evaluated as highly rationale (Rodríguez-Flores & Papadopoulos, 2020). Those values showed high accuracy in this study. The AUC values drawn by the ROC analysis were all 0.9 or higher. The values could be a high accuracy (Duch et al., 2010; Sasaki et al., 2017a; Sasaki et al., 2021). Hypothesis 1 that the two-dimensional space of the try scoring and the try conceding rate clarifies the concrete achievement value of the top teams had been verified. It was assumed that the relational structure between the try scoring and the try conceding rate would change exponentially. The exponential value of movement in these indicators was very low and close to the linear regression, but as mentioned in the method, the linear regression could lead to the zero intercept as unreal structure. It would be appropriate to show the value in the Figure 1 as the situation of curve fitting. Some approaches would clarify with the different structures between the top 8 and subsequent groups might deepen those interpretation (Sanz-Leon et al., 2015; Patel et al., 2020).
4.2. Cluster analysis
In the analysis of attack and defence performance within 22-m, the data tended to be relatively scattered, which increased the possibility of clustering cumulative ranking. As a result, from k₋means clustering, the concrete values of the four clusters were derived. As the attack indicator of the first cluster (1ST ~ 3RD place), the own scoring rate was “very high” (72% or more when the oppose 22m entries 5 times or more). As the defence indicator, the oppose scoring rate was “comparatively low” (60% or less in 4 times own 22m entries). It was confirmed that the attack and defence indicators were decreasing gradually in each cluster (2nd cluster’s own score 64~74% in entry 4~5 times and oppose score 58~74 % in entry 3.8-5 times: 3rd cluster’s own score rate 63~71% in entry 3.8 times and oppose score rate 68~88% in entry 4.2~4.9 times: 4th cluster’s own score 53~60 % in entry 3.2~3.3 times and oppose score rate 74~78 % in entry 5.2~5.3 times). The clusters showed the reference point of the actual teams’ attack and defence performance. Hypothesis 2 has been verified. A more detailed indicator mechanisms should be discussed for 22-m attack and defence, which would be important for try scoring and conceding (Hugh & Jones, 2005; Higham et al., 2014; Tiemery et al., 2017).
4.3. Network Analysis
From the above clustering, we analyzed the tactical differences among the ranking teams. The data was extracted from team and individual performance statistics (World Rugby, 2021b). Network analysis showed that the top three teams had high team performances. An interesting result was that the 4th and 5th place teams outperformed the upper teams in the number of individual runs (P-R; player runs) and clean breaks (P-CB; player clean-gain line-break). The performances of a specific individual were high. However, the top three teams might have many players who can score, and it might be said that they have team performance that does not depend on the individuals (Sasaki et al., 2013b; Sasaki et al., 2017a). It might be necessary to improve individual performances (characteristics of 4th and 5th place) as a stage for lower teams to enter the upper rankings. However, it might be said that many high-performance individuals were required to reach more higher rankings. Hypothesis 3 that network analysis could reveal the performance characteristics of top teams in rugby sevens had been verified.
Rugby Sevens would be a fusion of individual skills and team skills. For example, the success of an “off-road” pass is a feature of the high-ranking teams in the 2020 World Series (World Rugby, 2021a), However, it would be difficult to define whether this play is an individual skill or a team skill.
Furthermore, with the increase in international match events, there would be a risk of one-on-one collisions compared to the fifteen men’s side rugby. The relationship between injury and performance also needs to be considered longitudinally (Sasaki et al., 2017b; Hendricks & Brown, 2017; Tucker et al., 2017; Burger et al., 2020; Sasaki et al., 2020). Further data mining methods such as network analysis would be required to elucidate what kind of involvement structures various indicators in rugby sevens.
It should be discussed how the results could be interpreted from the perspective of previous studies and of the working hypotheses. The findings and their implications should be discussed in the broadest context possible. Future research directions may also be highlighted. This study clarified one evidence showing the key performance indicators of the rugby sevens top teams.
5. Conclusion
Try scoring rate in rugby sevens had down temporarily during last decade but then recovered. This study focused on the time required for scoring and conceding the try. Some specific achievement values for those at each ranking were extracted. Try scoring rate of 1st place of ranking was within 50 seconds, 2nd~4th was within 66 seconds, and 5th~8th was within 72 seconds in calculated cutoff values by ROC. Try conceding rate of 1st place of ranking was 124 seconds or more, 2nd~4th was 102 seconds or more, 5th~8th was 82 seconds or more. Attacking and defencing time baselines for try were shown as the gradual structure. To test the precision of sensitivity and specificity of this try scoring and conceding rate, Area Under the Curve (AUC) of ROC analysis showed the high AUC scores with above mentioned cut-off values of rugby sevens world ranking.
The analysis of attack and defence performance within 22-m showed that the attack indicator of the first cluster, the own scoring rate was 72% or more when the oppose 22m entries 5 times or more. As the defence indicator, the oppose scoring rate 60% or less in 4 times own 22m entries (2nd cluster’s own score 64~74% in entry 4-5 times and oppose score rate 58~74 % in entry 3.8~5 times: 3rd cluster’s own score rate 63~71% in entry 3.8 times and oppose score rate 68~88% in entry 4.2~4.9 times: 4th cluster’s own score 53~60 % in entry 3.2~3.3 times and oppose score rate 74~78 % in entry 5.2~5.3 times). The clusters showed the reference point of the actual teams’ attack and defence performance. From world ranking clustering and network analysis, we elucidated the structure in which the characteristics of team performance and individual performance changed step by step.
Author Contributions
Conceptualization, K.S.and H.S.; methodology, K.S., M.N.,and T.Y.; investigation, K.I., M.N., I.W., J.M., resources, K.S.,M.N. writing—original draft preparation, K.S.; writing—review and editing, M.N.; visualization, K.S.; supervision, T.K., I.K.; project administration, K.S.; funding acquisition, K.S; All authors have read and agreed to the published version of the manuscript.
Funding
This study was partly supported by JSPS KAKENHI grant number 19K11549(2019-2021) to K.S.
Institutional Review Board Statement
All procedures used in this study were approved by the Ethics Committee of the Research Centre for Health, Physical Fitness and Sports, Nagoya University, Japan. (19-10)
Informed Consent Statement
Informed consent was obtained from all participants involved in the study.
Conflicts of Interest
The authors declare no conflicts of interest associated with this manuscript.
References
Akoberg, A. K. (2007). Understanding diagnostic test 3: Receiver operating characteristic curves. Acta paediatr, 96(5), 644–647.
Burger, N., Lambert M., & Hendricks, S. (2020) Lay of the land: narrative synthesis of tackle research in rugby union and rugby sevens. BMJ Open Sport Exercise & Mededine, 6:e000645.
Carreras, D., Kraak, W., Planas, A., Martín, I., & Vaz, L. (2013). Analysis of International rugby sevens matches during tournaments. International Journal of Performance Analysis in Sport. 13, 833-847. https://doi.org/10.1080/24748668.2013.11868692
Duch, J., Weitzman, J. S., Amaral, L. A. N. (2010). Qualifying the performance of individual players in a team activity. PLOS ONE, 5(6), e10937.
Eades, P. (1984). A heuristic for graph drawing. Congressus Numerantium, 42(11), : 149-60.
Fruchterman, T. M. L., & Reingold, E. M. (1991). Graph drawing by force-directed placement. Software, 21(11),1129–64. https://doi.org/10.1002/spe.4380211102
Furukawa, T., Shimazaki, T., Nishimura, K., & Nakagawa, A. (2012). Game performance of sevens rugby at the world’s top level in recent years. Football Science, 9, 25-34.
Gajdos, P., Jezowicz, T., Uher, V., & Dohnalek, P. (2016). A parallel Frucherman-Reingold algorithm optimized for fast visualization of large graphs and swarm of data. Swarm and evolutionary Computation, 26, 56-63.
Hambrick, M. E., (2019). Social Network Analysis in Sport Research. Cambridge Scholars Publishing.
Hendricks, S., Till, K., & Brown, J. C. (2017). Rugby Union needs a contact skill-training programme. British Journal of Sports Medicine, 51, 829–30.
Higham, D. G, Hopkins W. G., Pyne D. B., & Anson J. M. (2014). Relationships between rugby sevens performance indicators and international tournament outcomes. Journal of quantitative analysis in sports, 10(7), 81-87. https://doi.org/10.1515/jqas-2013-0095
Hughes, M., & Jones, R. (2005). Patterns of play of successful and unsuccessful teams in men’s 7 a-side rugby union.Science and Football V: The Proceedings of the Fifth World Congress on Science and Football, 247-252.
Inoue, K., Shimozono, S., Yoshida, H., & Kurata, H. (2012). Application of Approximate Pattern Matching in Two Dimensional Spaces to Grid Layout for Biochemical Network Maps. Plos ONE, 7(6), 37739. https://doi.org/10.1371/journal.pone.0037739
Junker, B., & Schreiber, F. (2008). Analysis of Biological Networks. Hoboken (NJ): John & Wiley & Sons, Inc, 1-13.
Kamada, T., & Kawai, S. (1989). An algorithm for drawing general undirected graphs. Information Processing Letters, 31(1), 7–15.
Kojaku, S., & Matsuda, N. (2018). Core-periphery structure requires something else in the network. New Journal of physics, 20, 043012.
Newell, P., & Timmons, R. (2016). The Globalization and Environment Reader. Hoboken (NJ): Blackwell Publishing.
Nordlund, C. (2018). Power-relational core–periphery structures: Peripheral dependency and core dominance in binary and valued networks. Network Science, 6(3), 348-369.
Patel, D., Shah, D., Shah, M. (2020). The Intertwine of Brain and Body: A Quantitative Analysis on How Big Data Influences the System of Sports. Annals of data science, 7, 1-16.
Pereira, V. H., Gama, M. C. T., Sousa, F. A. B., Lewis, T.G., Gobatto, C.A., & Manchado-Gobatto, F. B. (2015). Complex network models reveal correlations among network metrics, exercise intensity and role of body changes in the fatigue process. Scientific Report, 5, 10489.
Putnam, R. D. (2001). Bowling alone: The Collapse and Revival of American Community. Simon and Schuster.
Ramos, J., Lopes, R. J., & Araújo, D. (2018). What’s next in complex networks? Capturing the concept of attacking play in invasive team sports. Sports Medicine, 48(1), 17-28.
Rodríguez-Flores, M. A., & Papadopoulos, F. (2020). Hyperbolic mapping of human proximity networks. Scientific Reports, 10, 20244.
Ross, A., Gill, N., & Cronin, J. (2014)Match analysis and player characteristics in rugby sevens. Sports Medicine, 44, 357-367.
Sanz-Leon, P., Knock, S. A., Spiegler, A., & Jirsa, V. K. (2015). Mathematical framework for large-scale brain network modelling in The Virtual Brain. NeuroImage. 111, 385-430. https://doi.org/10.1016/j.neuroimage.2015.01.002
Sasaki, K., Komatsu, K., Yamamoto, T., Ueno, Y., Katsuta, T., & Kono, I. (2013a). Cognitive societal human values of sports: After the 2011 disaster of Japan. Social Sciences. 2(1), 1–6. DOI: 10.11648/j.ss.20130201.11.
Sasaki, K., Yamamoto, T., Murakami, J., & Ueno, U. (2013b). Defence performance analysis of rugby union in Rugby World Cup 2011: network analysis of the turnover contributors. Performance Analysis of Sport IX, 94-99.
Sasaki, K., Yamamoto, T., Miyao, M,, Katsuta, T., & Kono, I. (2017a). Network centrality analysis to determine the tactical leader of a sports team. International Journal of Performance Analysis in Sport, 17(6), 822-831. https://doi.org/10.1080/24748668.2017.1402283
Sasaki, K., Watanabe, I., Yamamoto, T., Yamashita, S., Tanaka, A., & Okuwaki, T. (2017b). An empirical study of Japanese women’s rugby injury 2016. Japanese Journal of Rugby Science, 28(1), 56-60.
Sasaki, K., Sato, H., Nakamura, A., Yamamoto, T., Watanabe., I., Katsuta, T., & Kono, I. (2020). Clarifying the structure of serious head and spine injury in youth Rugby Union players. PLOS ONE, 15(7), e0235035.doi: 10.11648/j.ajss.20210901.12
Sasaki, K., Yamamoto, T., Watanabe, I., Nakayama, M., Iwabuchi, K., Katsuta, T., & Kono, I. (2021). Network centrality and core-periphery analysis to clarify the tactics for TRY in Rugby World Cup 2019. American Journal of Sports Science, 9(1), 8-16. doi: 10.11648/j.ajss.20210901.12
Shalley, C. E., & Perry-Smith, J. E. (2008). The emergence of team creative cognition: the role of diverse outside ties, socio-cognitive network centrality, and team evolution. Strategic Entrepreneurship Journal, 2(1), 23–41. https://doi.org/10.1002/sej.40
Suzuki T. (2017). Network Analysis. 2nd.ed. Tokyo (JPN): Kyouritsu Shuppan.
Tiemery, T., Tobin, D. P., Blake, C., & Delahunt, E. (2017). Attacking 22 entries in rugby union: running demands and differences between successful and unsuccessful entries. Scandinavian Journal of medicine & science in spots, 27(12), 1934-1941.
Tucker, R., Raftery, M., Kemp, S. (2017). Risk factors for head injury events in professional rugby union: a video analysis of 464 head injury events to inform proposed injury prevention strategies. British Journal of Sports Medicine, 51, 1152–7.
World Rugby. (2021a). World rugby game analysis reports. Retrieved February 1, 2021 from https://playerwelfare.worldrugby.org/?documentid=156.
World Rugby. (2021b). World rugby sevens-series stats 2000-2020. Retrieved February 7, 2021 from https://www.world.rugby/sevens-series/stats.
Yamamoto, Y., & Yokoyama, K. (2011). Common and unique network dynamics in football games. PLOS ONE, 6(12), e29638. https://doi.org/10.1371/journal.pone.0029638
Relevant Articles
-

Pilot study on changes in frontal oxygenated hemoglobin levels in beginners during practice of Karate Forms
by Kiyohisa Natsume - 2026,3
VIEW -
Why do you recall that smelly food? Effects of childhood residence region and potential reinforcing effect of marriage
by Yoshinori Miyamura - 2026,2
VIEW -
Accuracy of peripheral oxygen saturation (SpO₂) at rest determined by a smart ring: A Study in Controlled Hypoxic Environments
by Yohei Takai - 2025,6
VIEW -
A Study on the Effectiveness of Glycerophosphocholine (α-GPC) as an e-Sports Supplement
by Yuki Kamioka - 2025,5
VIEW